MethodOctober 31, 20267 min read
Break-Even Analysis: How to Calculate It and Use It to Make a Decision (Worked Example)
Break-even analysis tells you how many units you need to sell—or how much revenue you need—before a product, project, or business starts making money. Here's how to calculate your break-even point and use it to decide whether to proceed.
What Is Break-Even Analysis?
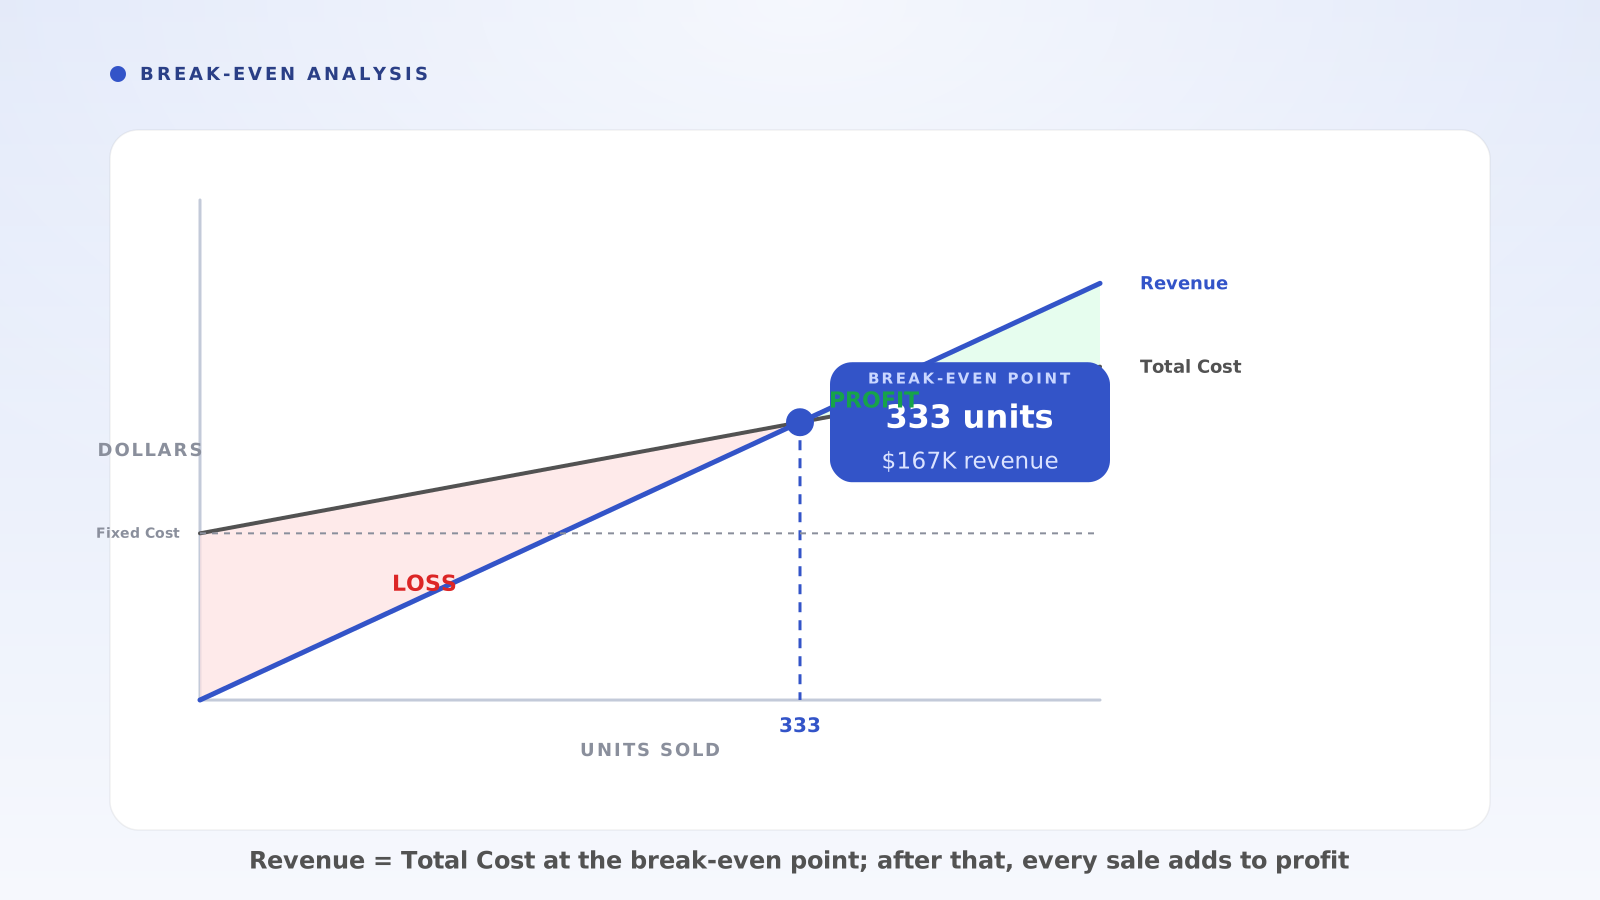
Break-even analysis determines the point at which total revenue equals total costs—the moment a venture stops losing money and starts making it. Before that point, every sale still leaves you in the red; after it, each additional sale contributes to profit. Knowing your break-even point tells you exactly how much volume you need to justify an investment.
The concept applies everywhere: launching a new product, opening a location, hiring a team, or running a marketing campaign. If you're spending money upfront or committing to ongoing costs, break-even analysis answers the fundamental question: how many units (or how much revenue) until this pays for itself?
The power of break-even analysis lies in its simplicity. Once you understand the relationship between fixed costs, variable costs, and contribution margin, you can model any decision in a few minutes. The output is a concrete number—not a vague 'it might work' but a specific threshold you can measure against realistic projections.
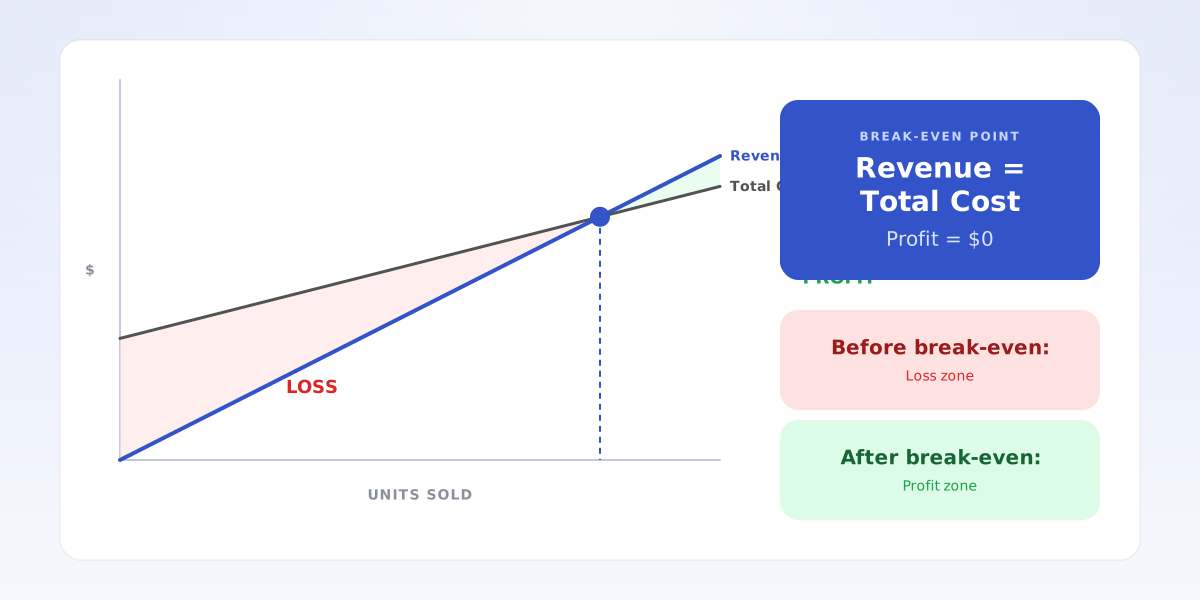
- Break-even point: the volume at which revenue = total costs (zero profit, zero loss)
- Before break-even: every sale reduces your loss but you're still in the red
- After break-even: each additional sale adds directly to profit
What Are Fixed Costs, Variable Costs, and Contribution Margin?
Fixed costs are expenses that don't change with sales volume. Rent, salaries, insurance, software subscriptions—these stay constant whether you sell one unit or ten thousand. If you shut down production entirely, fixed costs persist. In break-even analysis, fixed costs are the hurdle you must clear before reaching profitability.
Variable costs change with each unit sold. Raw materials, packaging, transaction fees, sales commissions—these scale directly with volume. If you sell twice as many units, variable costs roughly double. The variable cost per unit is the key input for calculating contribution margin.
Contribution margin is the difference between price and variable cost per unit. It's the amount each sale 'contributes' toward covering fixed costs and eventually generating profit. If you sell a product for $100 and variable costs are $40, your contribution margin is $60. Every sale adds $60 to the pool that pays off your fixed costs.
- Fixed costs: expenses that stay constant regardless of sales volume (rent, salaries, subscriptions)
- Variable costs: expenses that scale with each unit sold (materials, packaging, commissions)
- Contribution margin: price minus variable cost per unit—what each sale contributes to covering fixed costs
How Do You Calculate the Break-Even Point?
The break-even formula in units is: Break-Even Units = Fixed Costs ÷ Contribution Margin per Unit. If your fixed costs are $120,000 per year and each unit contributes $60 toward covering them, you need to sell 2,000 units to break even ($120,000 ÷ $60 = 2,000).
To express break-even in revenue instead of units, use: Break-Even Revenue = Fixed Costs ÷ Contribution Margin Ratio. The contribution margin ratio is contribution margin per unit divided by price. If your price is $100 and contribution margin is $60, the ratio is 0.60 (or 60%). Break-even revenue = $120,000 ÷ 0.60 = $200,000.
Both formulas tell the same story from different angles. Use units when you're planning production or inventory; use revenue when you're setting sales targets or comparing to market size. The underlying logic is identical: how much volume does it take for cumulative contribution margin to equal fixed costs?
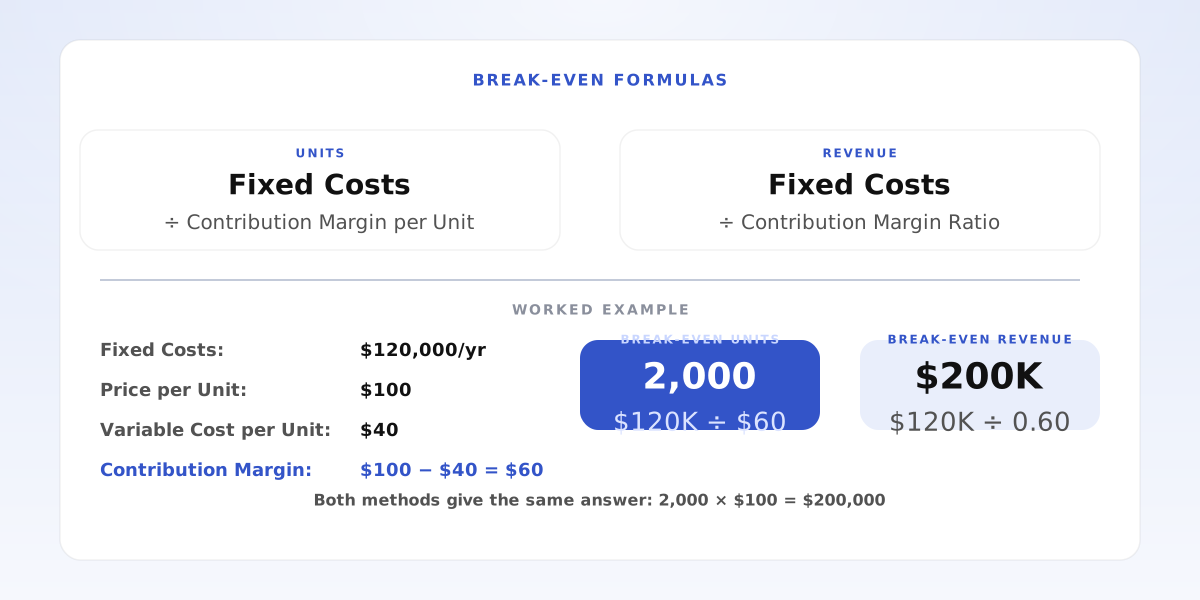
- Break-Even Units = Fixed Costs ÷ Contribution Margin per Unit
- Break-Even Revenue = Fixed Costs ÷ Contribution Margin Ratio
- Contribution Margin Ratio = Contribution Margin per Unit ÷ Price
Worked Example: Should We Launch This Product?
A company is considering launching a new SaaS tool. Fixed costs are $180,000 per year (server infrastructure $60,000, two engineers at $50,000 each, marketing budget $20,000). The product will sell for $50 per month, and variable costs are $10 per user per month (payment processing, customer support allocation, third-party API usage). Should they launch?
Step 1: Calculate contribution margin. Price per user per month: $50. Variable cost per user per month: $10. Contribution margin = $50 − $10 = $40 per user per month, or $480 per user per year.
Step 2: Calculate break-even in units. Break-Even Users = Fixed Costs ÷ Annual Contribution Margin per User = $180,000 ÷ $480 = 375 users. The company needs 375 paying users to break even.
Step 3: Calculate break-even in revenue. Contribution Margin Ratio = $40 ÷ $50 = 0.80. Break-Even Revenue = $180,000 ÷ 0.80 = $225,000 per year (or $18,750 per month). Alternatively, 375 users × $50/month × 12 months = $225,000—the numbers check out.
Step 4: Compare to projections. The team estimates they can acquire 500 users in Year 1 based on market research. Since 500 > 375, they'll exceed break-even and generate profit. Expected profit = (500 − 375) × $480 = $60,000. This is a cost-benefit analysis in miniature: the product is worth launching if the team's user projection is realistic.
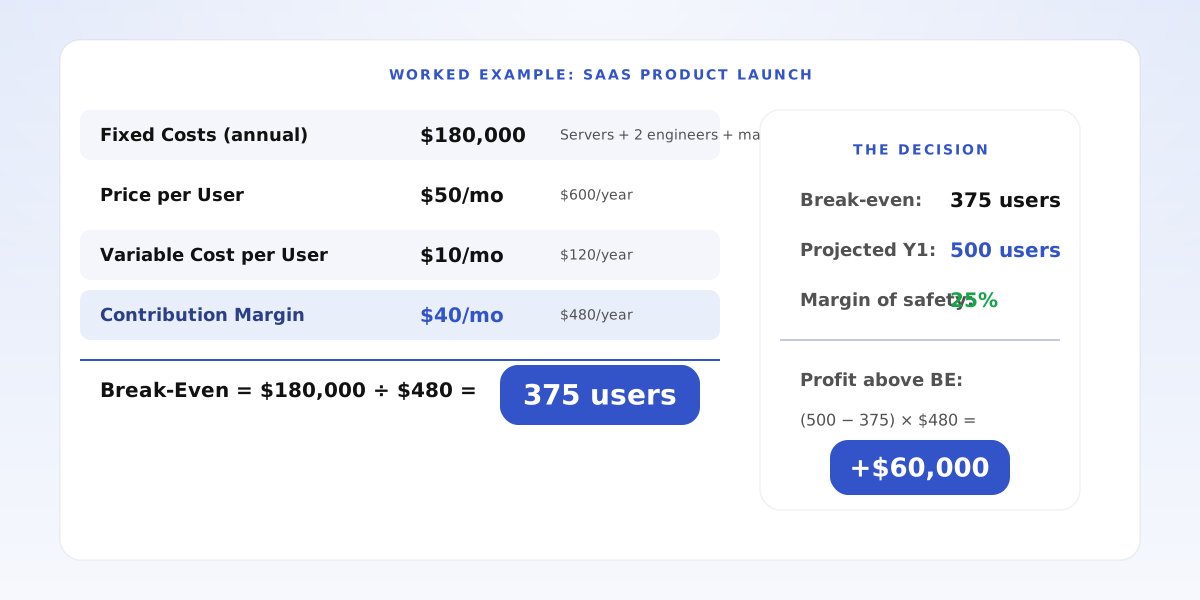
- Fixed costs: $180,000/year (infrastructure + team + marketing)
- Contribution margin: $40/user/month = $480/user/year
- Break-even: 375 users (or $225,000 revenue)
- Projection: 500 users → $60,000 profit above break-even
How Do You Use Break-Even Analysis to Make a Decision?
Once you have the break-even point, compare it to realistic projections. If break-even requires 2,000 units and your market research says you can sell 3,000, you have a margin of safety—room for projections to be wrong and still come out ahead. If break-even requires 2,000 and you can only sell 1,500, the project doesn't work without changing the economics.
The margin of safety is the gap between projected sales and break-even: (Projected Units − Break-Even Units) ÷ Projected Units. If you project 3,000 and break-even is 2,000, your margin of safety is 33%. That means projections can be off by a third before you lose money. Higher is safer; if your margin is 10%, a small miss wipes out profit.
Break-even analysis also reveals which variables matter most. What if you raised the price $10? What if you cut variable costs by 20%? What if fixed costs increased? Running these scenarios shows where to focus effort. A small change in contribution margin can dramatically shift break-even—which is why pricing decisions deserve careful attention.
- If projected volume > break-even, the project is financially justified
- Margin of safety = (Projected − Break-Even) ÷ Projected—measures room for error
- Sensitivity analysis: test how changes in price, costs, or volume shift break-even
What Are Common Mistakes in Break-Even Analysis?
The first mistake is misclassifying costs. Some costs look fixed but actually vary with scale (support headcount, for example), and some variable costs have fixed components (a payment processor's monthly fee plus per-transaction charge). Get the classification right or your contribution margin will be wrong, throwing off the entire calculation.
The second mistake is ignoring the time dimension. Break-even analysis often assumes steady-state economics, but startups ramp slowly. If you need 375 users to break even annually, you won't have 375 on day one—you'll have 10, then 50, then 150. The cash runway to reach break-even matters as much as the number itself. Model the ramp, not just the endpoint.
The third mistake is treating break-even as the goal. Breaking even means zero profit—survival, not success. Use break-even to sanity-check whether a project is viable, but the real question is how far past break-even you can realistically go. A decision tree can help you model the probability-weighted outcomes beyond the break-even threshold.
- Don't misclassify costs: semi-variable costs need careful splitting
- Don't ignore time: model the ramp to break-even, not just the endpoint
- Don't aim for break-even: it's a viability check, not the target
Frequently Asked Questions
How do I handle multiple products with different margins? Calculate contribution margin for each product, then weight them by expected sales mix. If Product A contributes $60 per unit and represents 70% of sales, and Product B contributes $30 and represents 30%, the weighted average contribution margin is ($60 × 0.70) + ($30 × 0.30) = $51. Use that for break-even.
What discount rate should I use for multi-year analysis? For straightforward break-even, you often don't need discounting—you're asking 'when do we hit zero profit,' not 'what's the NPV.' But if you're comparing break-even timing across options with different time horizons, apply your cost of capital (typically 8–12%). See cost-benefit analysis for the full NPV approach.
What if my costs step-change at certain volumes? Break-even analysis assumes linear costs, but real businesses often hit capacity thresholds (need a bigger server, hire another person). Model these as segments: calculate break-even for the first cost tier, then separately for volumes above it. This is common in profitability analysis for scaling businesses.
How does break-even relate to payback period? Payback period measures how long it takes to recoup an investment; break-even measures what volume is needed to cover costs. They're related but not identical. Payback includes time; break-even often doesn't. Use payback when timing matters (cash flow constraints), break-even when volume is the core question.
- Multiple products: use weighted-average contribution margin by sales mix
- Multi-year analysis: apply discounting if comparing time horizons; skip if timing isn't the question
- Step-change costs: model each cost tier separately
- Break-even vs. payback: volume threshold vs. time to recoup—both matter
Putting Break-Even Analysis Into Practice
Identify the decision: a product launch, a new hire, a marketing campaign. List your fixed costs—everything that stays constant regardless of volume. Calculate variable cost per unit. Subtract from price to get contribution margin. Divide fixed costs by contribution margin: that's your break-even point. Compare to realistic projections and calculate your margin of safety.
Razn is an AI workspace that helps you structure business problems into issue trees, hypotheses, and answer-first recommendations. When you need to run a break-even analysis—gathering costs, calculating contribution margin, modeling scenarios—Razn helps you organize the thinking and present a clear recommendation. Razn is free during beta.
- List fixed costs, calculate variable cost per unit, subtract from price for contribution margin
- Break-Even = Fixed Costs ÷ Contribution Margin—compare to projections
- Document assumptions so stakeholders can challenge them