MethodOctober 29, 20267 min read
Decision Tree Analysis: How to Make Better Business Decisions With Expected Value (Worked Example)
Decision tree analysis maps out choices, outcomes, and probabilities to calculate the expected value of each path. Here's how to build one and use it to make better decisions.
What Is Decision Tree Analysis?
Decision tree analysis is a method for mapping out decisions under uncertainty by visualizing choices, possible outcomes, and their probabilities. Each path through the tree leads to a payoff, and by weighting those payoffs by their likelihood, you calculate the expected value of each option—giving you a rational basis for choosing when outcomes are uncertain.
A decision tree has two types of nodes: decision nodes (squares) where you choose between options, and chance nodes (circles) where outcomes occur based on probability. Branches from decision nodes represent your choices; branches from chance nodes represent possible outcomes with assigned probabilities. The endpoint of each path is a payoff—positive or negative—expressed in dollars or another consistent unit.
The power of decision tree analysis lies in making uncertainty explicit. Instead of picking an option based on the best-case scenario or gut feel, you weigh every outcome by how likely it is. A 10% chance at $1M isn't worth more than a 90% chance at $200K—the expected values are $100K and $180K respectively. Decision trees surface these trade-offs so you can decide with clarity.
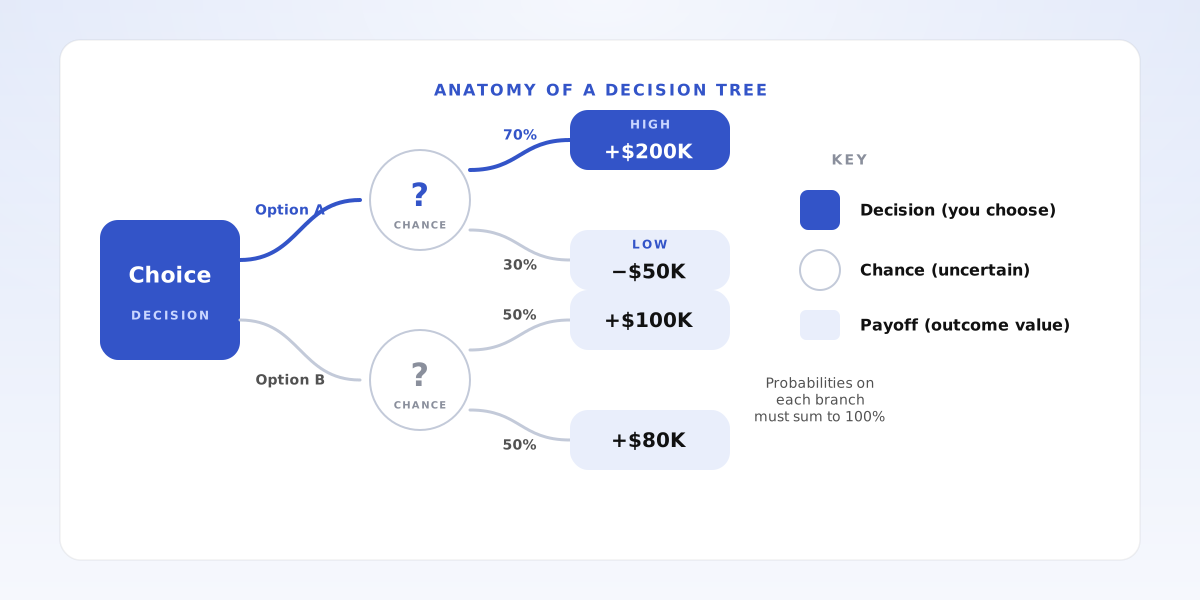
- Decision tree analysis maps choices, probabilities, and outcomes to calculate expected value
- Decision nodes (squares) = choices you control; chance nodes (circles) = uncertain outcomes
- Expected value = sum of (probability × payoff) for each outcome
How Do You Build a Decision Tree Step by Step?
Step 1: Define the decision. What choice are you facing? Be specific. 'Should we expand?' is too vague; 'Should we launch Product X in Q2 or wait until Q4?' is actionable. Your decision node is the starting point of the tree.
Step 2: Map out your options. Each branch from the decision node represents a choice. For a launch decision, you might have 'Launch now', 'Launch later', or 'Don't launch'. These are the paths you control.
Step 3: Identify uncertain outcomes for each option. What could happen after each choice? For 'Launch now', the market might respond well (high sales) or poorly (low sales). Each option becomes a chance node with branches for each possible outcome.
Step 4: Assign probabilities. Based on research, historical data, or informed judgment, estimate the likelihood of each outcome. Probabilities from each chance node must sum to 100%. If you're uncertain, use ranges and test sensitivity later.
Step 5: Estimate payoffs. At the end of each path, assign a payoff in dollars (or whatever unit you're optimizing). Include costs: if launching costs $200K and yields $500K revenue, the payoff is $300K net.
Step 6: Calculate expected values. Work backward from the endpoints. Multiply each payoff by its probability, then sum them at each chance node. At each decision node, pick the branch with the highest expected value. The result tells you which choice maximizes expected value. Connect this to opportunity cost analysis—the expected value of the path not taken is the opportunity cost of your choice.
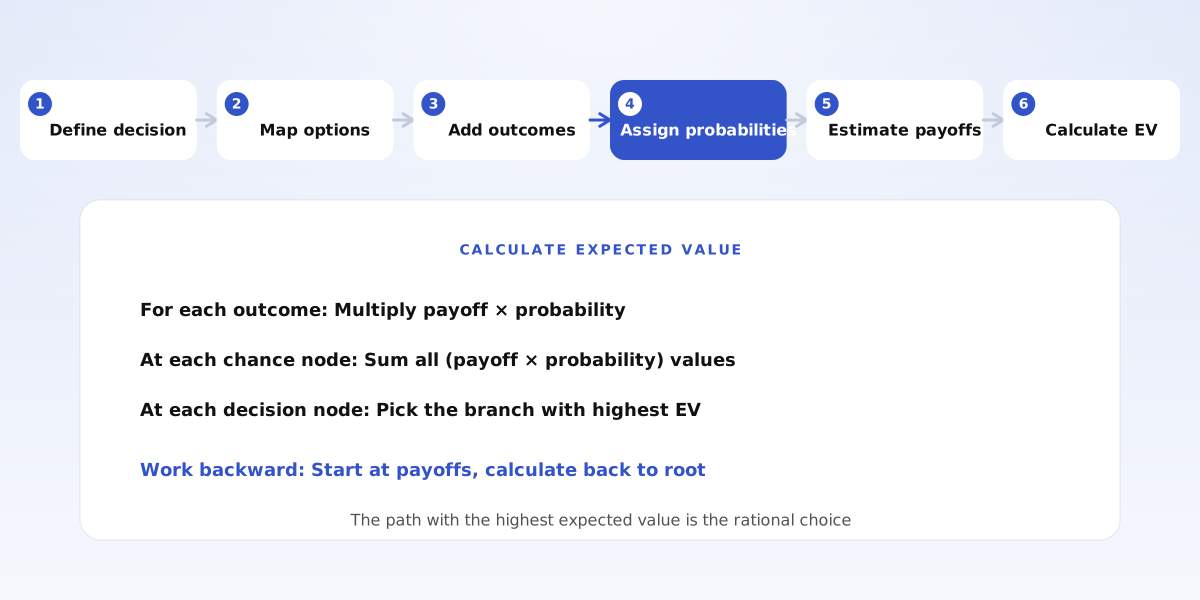
- Step 1: Define the specific decision at the root
- Step 2: Map branches for each option you control
- Step 3: Add chance nodes with possible outcomes for each option
- Step 4: Assign probabilities to each outcome (sum to 100%)
- Step 5: Estimate the payoff at the end of each path
- Step 6: Calculate expected value by working backward through the tree
Worked Example: Should We Launch the Premium Tier?
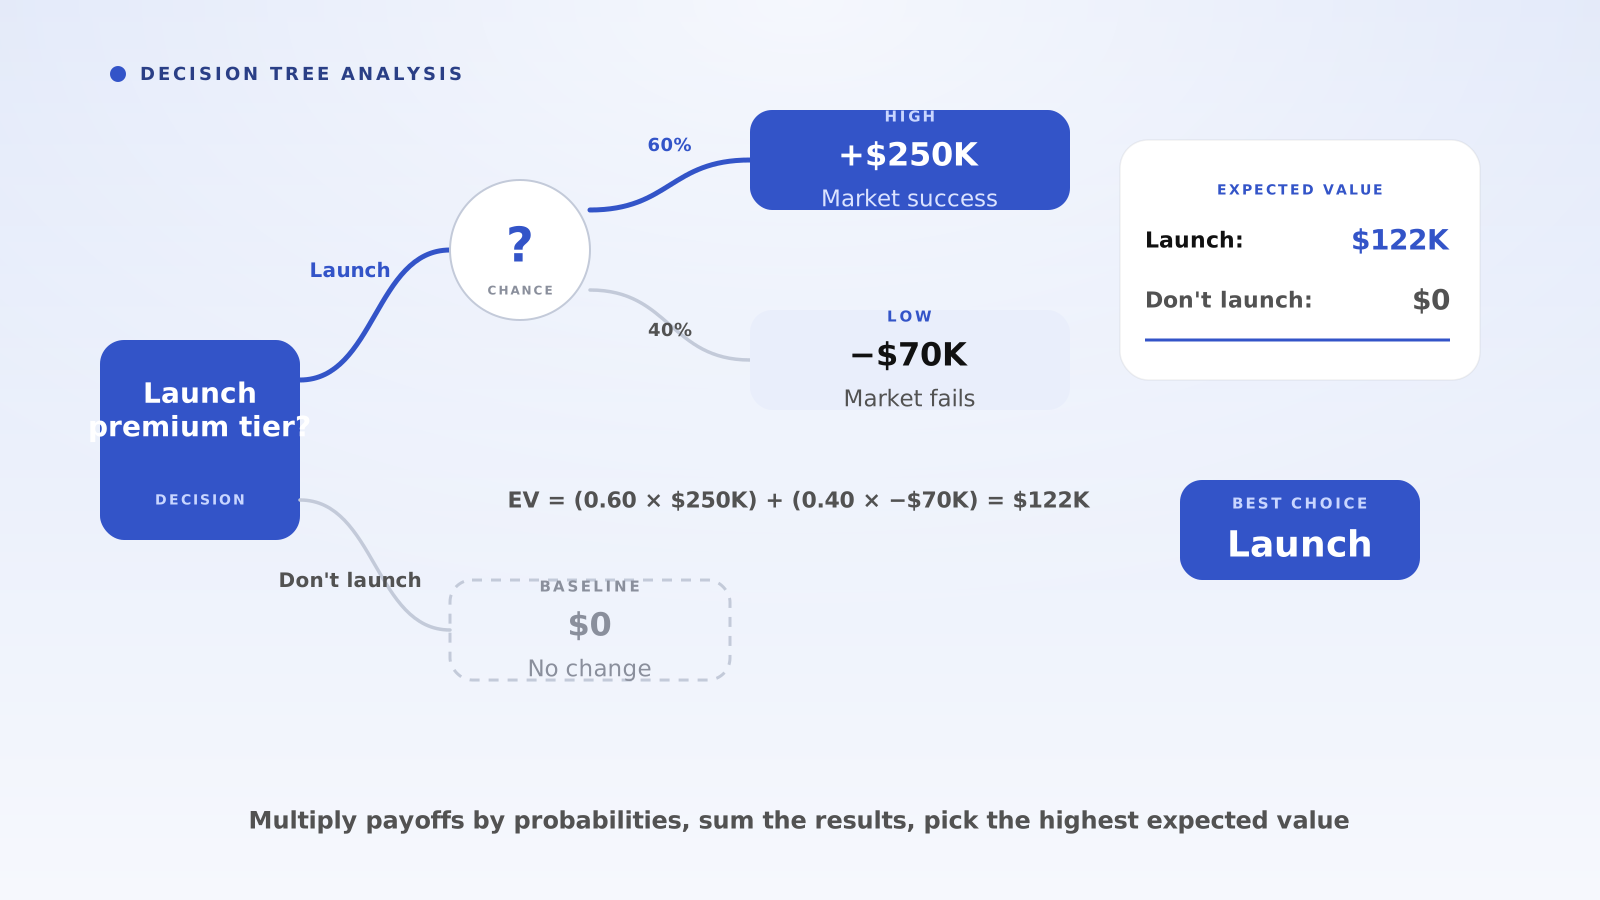
A SaaS company is deciding whether to launch a premium tier. The launch costs $150K in development and marketing. If the market responds well (estimated 60% probability), the tier generates $400K in first-year profit. If the market responds poorly (40% probability), it generates only $80K. Should they launch?
First, draw the tree. The decision node offers two choices: Launch or Don't Launch. The 'Launch' branch leads to a chance node with two outcomes: 'Market responds well' (60%, payoff = $400K − $150K = $250K net) and 'Market responds poorly' (40%, payoff = $80K − $150K = −$70K net). The 'Don't Launch' branch has no uncertainty—the payoff is $0.
Next, calculate expected value. For the Launch path: EV = (0.60 × $250K) + (0.40 × −$70K) = $150K − $28K = $122K. For Don't Launch: EV = $0. The expected value of launching ($122K) exceeds the expected value of not launching ($0), so the rational choice is to launch.
Now test sensitivity. What if the probability of success is only 40% instead of 60%? EV = (0.40 × $250K) + (0.60 × −$70K) = $100K − $42K = $58K—still positive. What probability makes launching break even? Set EV = 0: (p × $250K) + ((1−p) × −$70K) = 0. Solving: p = $70K / $320K ≈ 22%. As long as you believe there's more than a 22% chance of success, launching has positive expected value. This kind of threshold analysis helps you decide how confident you need to be before committing. If you're uncertain about the 60% estimate, a pre-mortem can help you stress-test the assumptions.
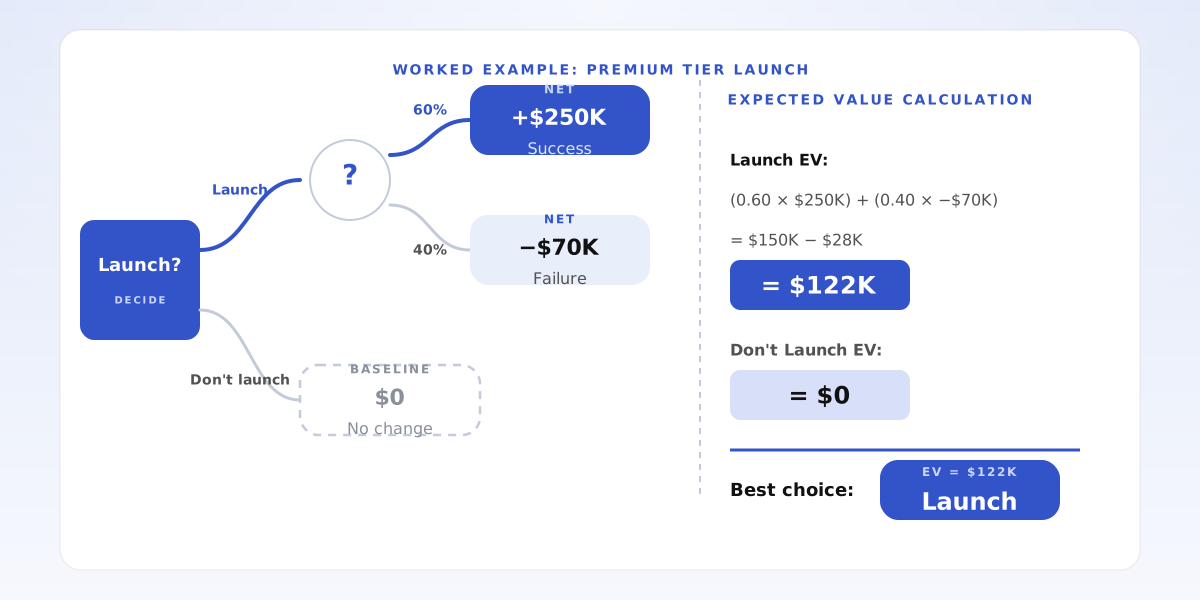
- Launch: EV = (0.60 × $250K) + (0.40 × −$70K) = $122K
- Don't Launch: EV = $0
- Decision: Launch (higher expected value)
- Breakeven probability: 22%—if success odds exceed this, launch is justified
When Should You Use Decision Tree Analysis?
Use decision tree analysis when you face a choice with uncertain outcomes and can estimate probabilities and payoffs. It's especially valuable for sequential decisions—where one choice opens or closes future options—and for comparing asymmetric risks. A decision with 90% upside and 10% downside looks different from one with 50/50 odds; the tree quantifies this.
Good candidates include product launches, capital investments, hiring decisions, and market entry. These involve meaningful uncertainty, quantifiable outcomes, and enough at stake to justify the analysis. For smaller decisions, simpler frameworks like a decision matrix or quick cost-benefit analysis may suffice.
Decision tree analysis is less useful when probabilities are unknowable (truly novel situations) or when outcomes can't be quantified. In those cases, combine it with scenario planning or first-principles thinking. Use the tree to structure what you know, then acknowledge what you don't.
- Use it for decisions with uncertain outcomes where probabilities and payoffs can be estimated
- Ideal for sequential decisions, product launches, investments, and market entry
- Less useful when probabilities are unknowable or outcomes can't be quantified
Common Mistakes in Decision Tree Analysis
The first mistake is false precision. Assigning 63.7% probability to an outcome suggests you know more than you do. Round to sensible figures (60%, 70%) and focus on getting the direction right. Test sensitivity: if the decision flips when probabilities shift by 10%, you need more confidence in the estimate.
The second mistake is ignoring correlations. If multiple outcomes are driven by the same underlying factor (e.g., economic conditions), don't treat them as independent. A recession might affect both the probability of market acceptance and the severity of the downside.
The third mistake is optimism bias on payoffs. Teams overestimate revenue and underestimate costs. Counter this by using conservative estimates or by running scenarios with pessimistic assumptions. If the decision still holds under pessimistic numbers, you have a robust choice.
The fourth mistake is stopping at one decision. Real decisions are sequential: Launch → then Price → then Expand. Extended trees capture these dependencies. The value of the first decision depends on the options it opens or closes later. This connects to second-order thinking—ask what happens next.
- Avoid false precision: round probabilities and test sensitivity
- Don't ignore correlations between outcomes driven by the same factor
- Counter optimism bias with conservative estimates and pessimistic scenarios
- Model sequential decisions: the value of today's choice depends on tomorrow's options
Frequently Asked Questions
How do I estimate probabilities when I don't have data? Start with your best judgment, informed by analogies, expert opinions, or base rates from similar situations. Then test sensitivity. If the decision is robust across a wide range of probabilities (say, 30%–70%), the exact estimate matters less. If it flips at 45%, you need to sharpen your estimate before deciding.
What if payoffs are hard to quantify? Use the best proxy available. A strategic initiative might be valued by the revenue it protects rather than generates. A risk might be quantified by the cost of the worst-case outcome times its probability. Rough quantification is better than no quantification—it surfaces trade-offs that stay hidden in qualitative discussions.
How do I handle many possible outcomes? Group them into a manageable number (3–5) that capture the key scenarios: optimistic, base case, pessimistic. Trying to model 20 outcomes creates complexity without improving decisions. Simplify until the tree is useful, not until it's exhaustive.
How does decision tree analysis relate to expected value? Expected value is the output of the analysis. You calculate it by multiplying each outcome's payoff by its probability and summing the results. Decision tree analysis is the method; expected value is the metric. The path with the highest expected value is the rational choice under uncertainty.
- No data? Use judgment, analogies, or base rates, then test sensitivity
- Hard to quantify? Use proxies—rough estimates beat hidden trade-offs
- Many outcomes? Group into 3–5 scenarios (optimistic, base, pessimistic)
- Expected value is the output; decision tree analysis is the method
Putting Decision Tree Analysis Into Practice
Identify a decision you're facing that involves uncertainty. Draw the decision node and your options. For each option, map the possible outcomes as branches from chance nodes. Assign probabilities and payoffs. Calculate expected values by working backward. Choose the path with the highest expected value—and document your assumptions so others can challenge them.
Razn is an AI workspace that helps you structure problems into issue trees, decision frameworks, and answer-first documents. When you need to build a decision tree—mapping options, assigning probabilities, calculating expected values—Razn helps you organize the analysis and present the recommendation clearly. Use it when the decision is complex enough to document and share.
- Draw the tree: decision node → options → chance nodes → outcomes → payoffs
- Calculate expected values by working backward through the tree
- Document assumptions so stakeholders can challenge and refine them