MethodOctober 28, 20267 min read
Cost-Benefit Analysis: How to Do One Step by Step (With a Worked Example)
A cost-benefit analysis compares what a decision costs against what it delivers. Here's how to do one step by step, with a worked example and NPV calculation.
What Is a Cost-Benefit Analysis?
A cost-benefit analysis (CBA) is a systematic process for comparing the total costs of a decision against its total benefits, expressed in monetary terms. If the benefits exceed the costs, the decision is financially justified; if costs exceed benefits, it isn't. The framework forces you to quantify both sides of the ledger—making trade-offs explicit rather than relying on gut feel.
Cost-benefit analysis is used everywhere: governments evaluate infrastructure projects, companies decide whether to launch products, and individuals weigh major purchases. The power of the method lies in its universality—once you translate costs and benefits into the same unit (usually dollars), you can compare wildly different options on equal footing. A marketing campaign versus a new hire? Convert both to expected value and compare.
The discipline of listing every cost and benefit surfaces hidden factors. A new software system has obvious costs (license fees, implementation) but also hidden ones (training time, productivity dip during transition, opportunity cost of the team working on rollout instead of other projects). Benefits often hide too: a faster checkout flow improves conversion rate, but also reduces support tickets and increases customer satisfaction. Cost-benefit analysis forces you to find them all.
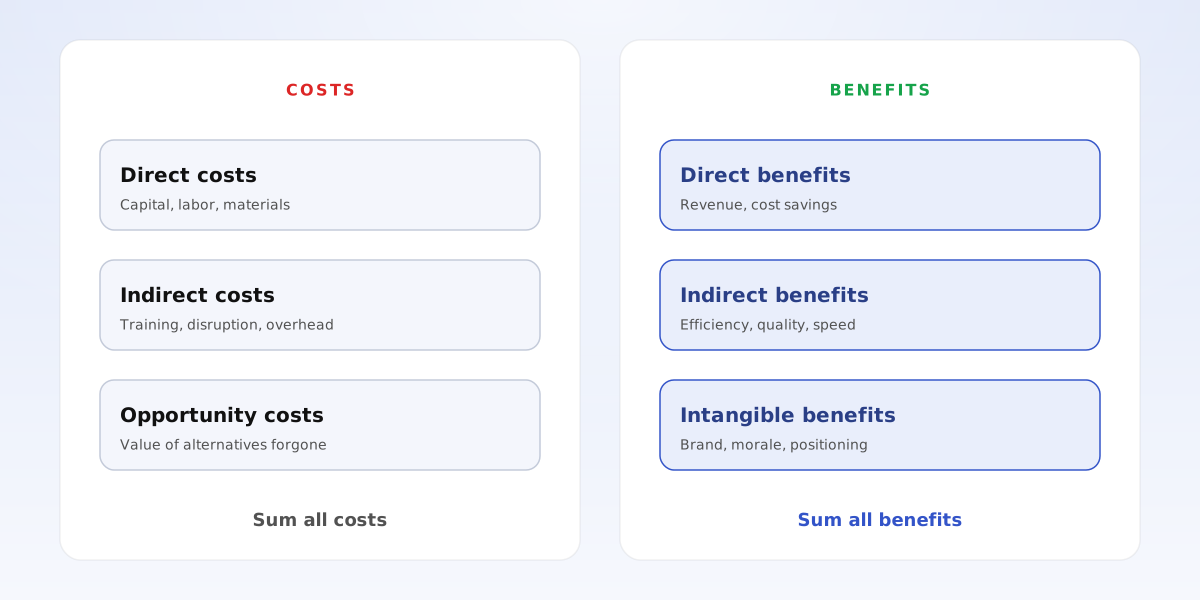
- Cost-benefit analysis compares total costs against total benefits in monetary terms
- If benefits > costs, the decision is justified; if costs > benefits, reconsider
- The discipline forces you to quantify hidden costs and overlooked benefits
How Do You Conduct a Cost-Benefit Analysis Step by Step?
Step 1: Define the decision and alternatives. What are you evaluating? Be specific. 'Should we expand to Europe?' is too vague; 'Should we open a Berlin office in Q2 with a 10-person team?' is actionable. Also define the baseline—what happens if you do nothing? Every cost-benefit analysis compares an action to the status quo.
Step 2: List all costs. Include direct costs (capital expenditure, operating expenses, labor), indirect costs (management time, disruption to existing operations), and opportunity costs (what you'd gain by investing the same resources elsewhere). Don't forget one-time versus recurring costs—a software license may cost $50K upfront and $10K annually.
Step 3: List all benefits. Include direct benefits (revenue, cost savings) and indirect benefits (brand value, employee morale, strategic positioning). Some benefits are hard to quantify—customer satisfaction, for example—but estimate anyway. A range ($50K–$100K in reduced churn) is better than ignoring the benefit entirely.
Step 4: Monetize everything. Convert all costs and benefits to dollar values. For items spanning multiple years, use present value by discounting future cash flows. A benefit of $100K in three years is worth less than $100K today—how much less depends on your discount rate (typically 5–15% for corporate decisions). See the worked example below for the math.
Step 5: Calculate net present value (NPV) and benefit-cost ratio. NPV = Total present value of benefits − Total present value of costs. If NPV > 0, the project creates value. The benefit-cost ratio (BCR) = Total benefits ÷ Total costs. If BCR > 1.0, benefits exceed costs. Both metrics tell you the same story from different angles.
Step 6: Sensitivity analysis. Test your assumptions. What if costs are 20% higher? What if benefits take six months longer to materialize? Identify which assumptions matter most—if a small change in customer adoption flips the decision, you need more confidence in that estimate before proceeding. This is where a pre-mortem helps you stress-test the plan.
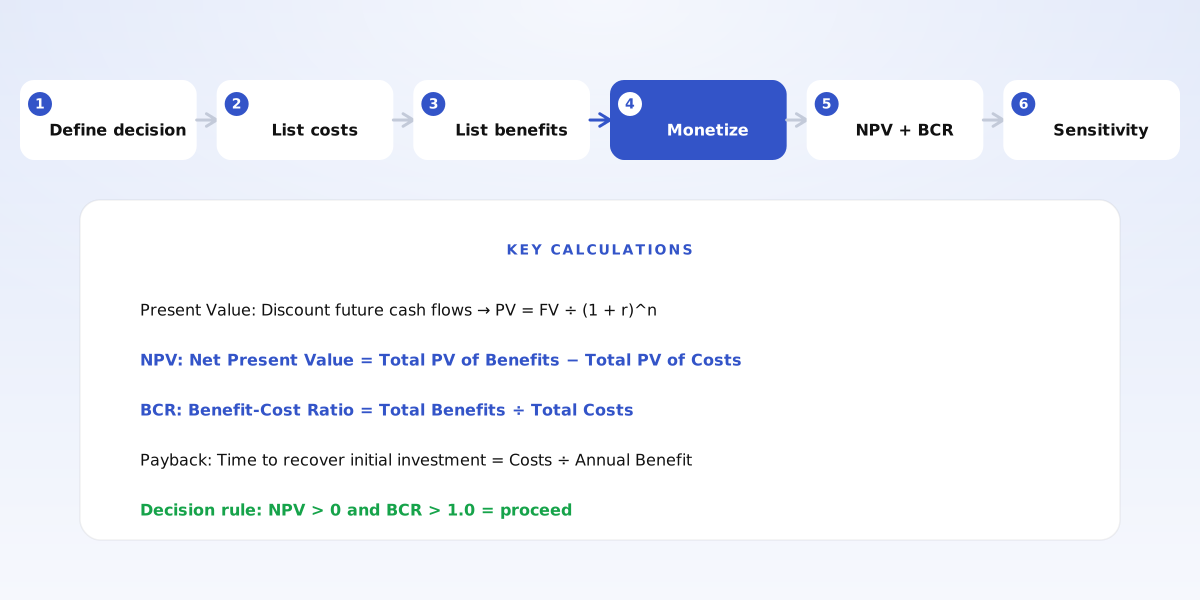
- Step 1: Define the specific decision and the do-nothing baseline
- Step 2: List all costs—direct, indirect, and opportunity costs
- Step 3: List all benefits—direct, indirect, and intangible benefits
- Step 4: Convert everything to present-value dollars using a discount rate
- Step 5: Calculate NPV (benefits − costs) and BCR (benefits ÷ costs)
- Step 6: Run sensitivity analysis on key assumptions
Worked Example: Should We Automate the Order Fulfillment Process?
A company is considering investing $200K in warehouse automation. The system is expected to reduce labor costs by $80K per year and reduce error-related returns by $15K per year. Implementation will disrupt operations for two months, costing an estimated $20K in lost productivity. The system has a five-year useful life. The company uses a 10% discount rate. Should they proceed?
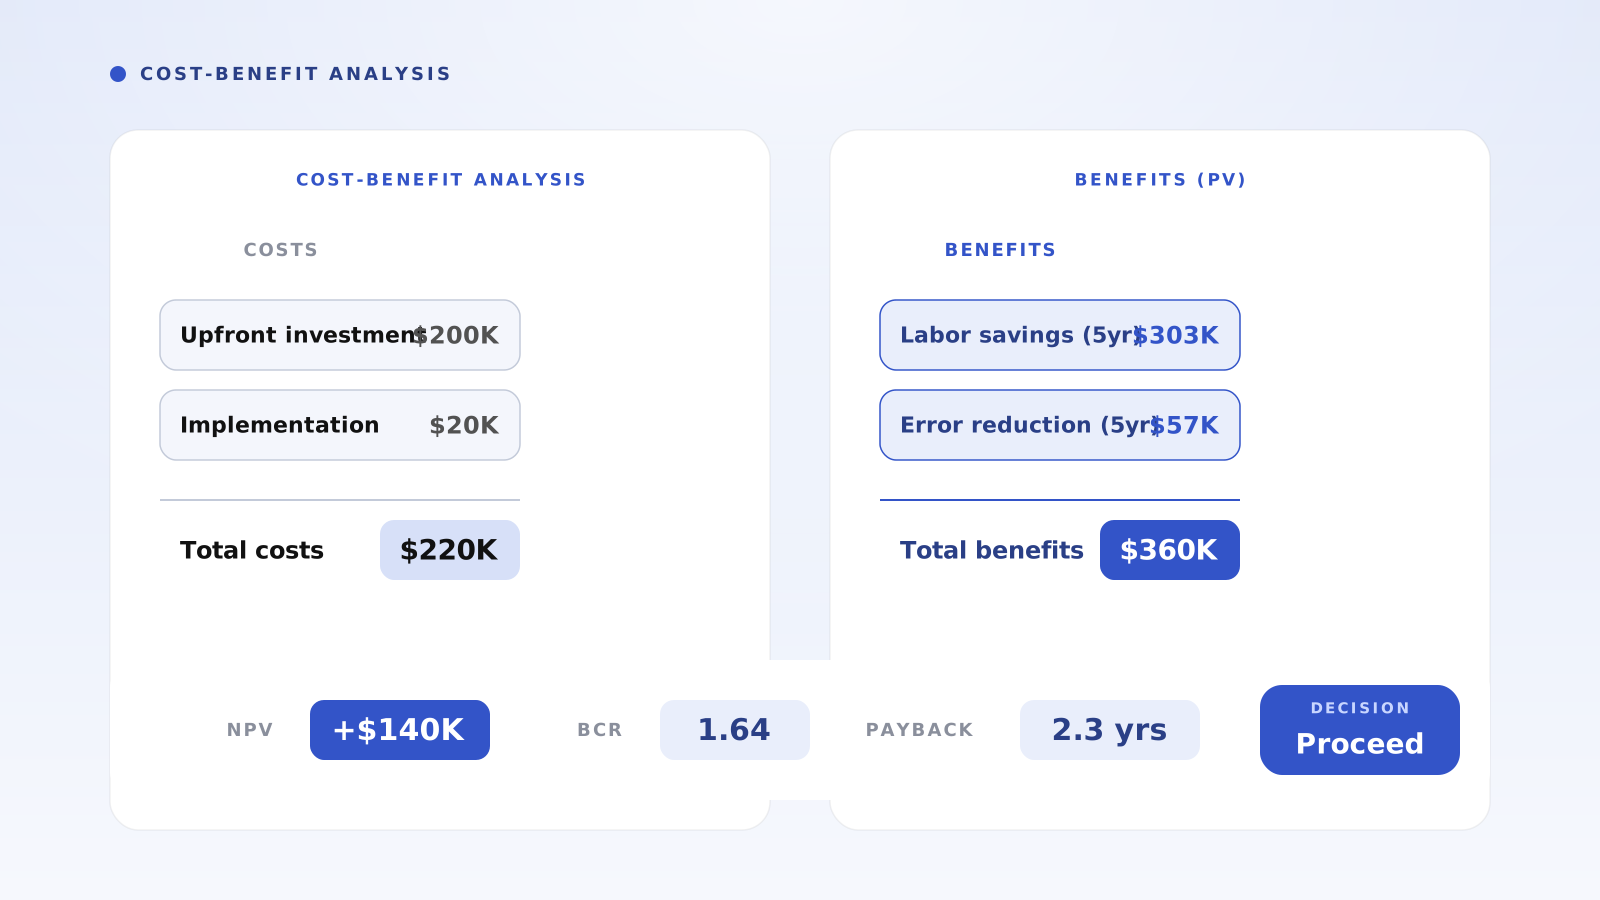
First, list and monetize the costs. Upfront investment: $200K (Year 0). Implementation disruption: $20K (Year 0). Total costs: $220K.
Next, list and monetize the benefits. Annual labor savings: $80K (Years 1–5). Annual error reduction: $15K (Years 1–5). Total annual benefit: $95K. To calculate present value, discount each year's benefit: Year 1: $95K ÷ 1.10 = $86.4K. Year 2: $95K ÷ 1.21 = $78.5K. Year 3: $95K ÷ 1.33 = $71.4K. Year 4: $95K ÷ 1.46 = $65.1K. Year 5: $95K ÷ 1.61 = $59.0K. Total present value of benefits: $360.4K.
Calculate NPV and BCR. NPV = $360.4K − $220K = $140.4K. The project creates $140K in value. BCR = $360.4K ÷ $220K = 1.64. Every dollar invested returns $1.64. Payback period: $220K ÷ $95K = 2.3 years. The investment pays for itself in under three years.
Sensitivity test: What if labor savings are only $60K/year? New annual benefit: $75K. New PV of benefits: $284.2K. New NPV: $64.2K—still positive. The project remains justified even with a 25% reduction in expected savings. This analysis shows a clear 'yes'—but the decision memo should document the assumptions so stakeholders can challenge them.
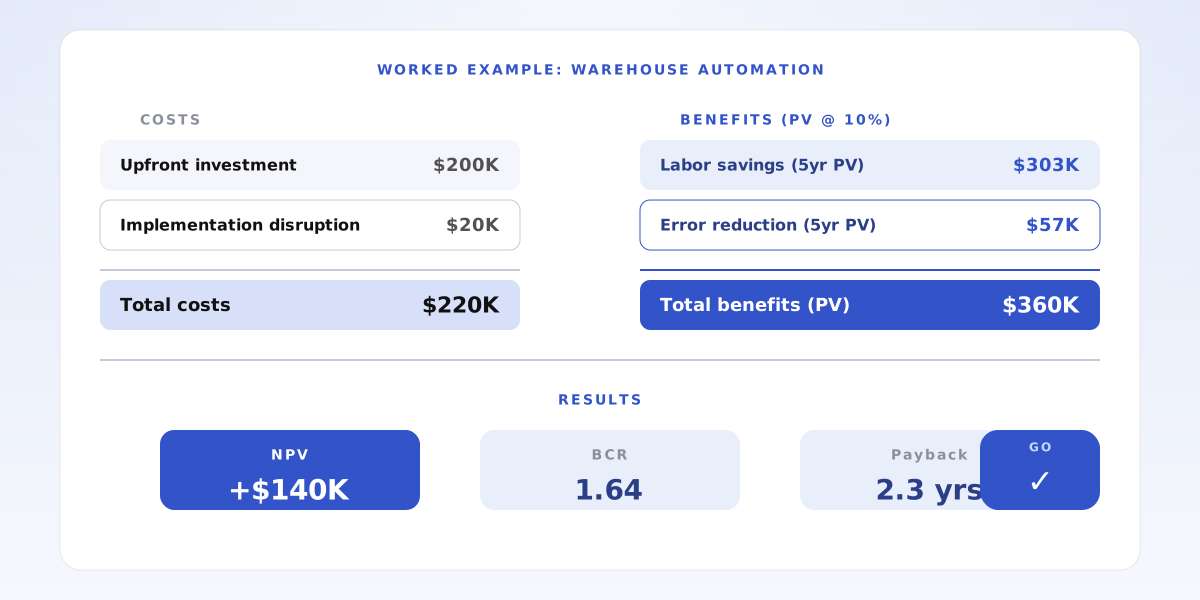
- Costs: $200K upfront + $20K disruption = $220K total
- Benefits: $95K/year × 5 years, discounted to $360.4K present value
- NPV: +$140.4K (project creates value)
- BCR: 1.64 (every $1 invested returns $1.64)
- Payback: 2.3 years
When Should You Use a Cost-Benefit Analysis?
Use a cost-benefit analysis when you're considering a significant investment of resources—capital, time, or people—and want to know whether the expected return justifies the outlay. It's most useful for decisions that are quantifiable, time-bounded, and have clear alternatives. Capital expenditure decisions, product launches, hiring decisions, and process improvements are all good candidates.
Cost-benefit analysis is less suited for strategic bets where the upside is speculative or transformational. If you're deciding whether to pivot the company into a new market, CBA can inform the decision but won't capture the full strategic calculus. In those cases, combine CBA with first-principles thinking and second-order thinking to reason through implications that don't fit in a spreadsheet.
Also use CBA when you need to justify a decision to stakeholders. A clear NPV and BCR make the business case easy to communicate. When someone asks 'Why are we doing this?', you can point to the analysis. This is why documenting assumptions matters—a decision matrix can help compare options across multiple criteria, but CBA gives you the hard numbers for the financial dimension.
- Use CBA for significant investments where costs and benefits are quantifiable
- Less suited for speculative strategic bets—complement with strategic frameworks
- Useful for stakeholder buy-in: NPV and BCR make the case easy to explain
What Are Common Mistakes in Cost-Benefit Analysis?
The first mistake is omitting costs. People undercount indirect costs (management oversight, training time) and ignore opportunity costs entirely. A project that 'only' costs $100K in cash might consume $50K of senior leader time and foreclose $200K in alternative investments. List costs exhaustively before calculating.
The second mistake is overestimating benefits. Optimism bias is real—teams systematically overrate revenue projections and underrate time-to-impact. Counter this by using conservative estimates or by assigning probability-weighted values. If there's a 70% chance of $100K benefit and 30% chance of $0, the expected value is $70K, not $100K.
The third mistake is ignoring the time value of money. A benefit of $100K next year is worth less than $100K today. Failure to discount future cash flows makes distant benefits look more attractive than they are. Always convert to present value using an appropriate discount rate.
The fourth mistake is not testing assumptions. A single-point estimate creates false confidence. If your CBA depends on customer acquisition costing $50/user, what happens if it's $75? Sensitivity analysis reveals which assumptions are load-bearing and where you need more data before committing. This connects to root cause analysis—dig into the assumptions, not just the numbers.
- Omitting costs: Include indirect and opportunity costs, not just direct spend
- Overestimating benefits: Use conservative estimates or probability-weighted values
- Ignoring time value: Discount future cash flows to present value
- Skipping sensitivity analysis: Test what happens if key assumptions change
Frequently Asked Questions
How do I monetize intangible benefits like brand value or employee morale? Estimate proxies. Brand value might show up in customer willingness to pay a premium or reduced customer acquisition cost. Employee morale affects turnover—estimate the cost of replacing an employee ($50K–$150K in recruiting and lost productivity) and multiply by the expected reduction in attrition. A range is fine; the point is to include these factors rather than ignore them.
What discount rate should I use? For corporate decisions, 8–12% is typical, reflecting the company's cost of capital plus a risk premium. For personal decisions, use a rate that reflects your alternatives (what return could you earn by investing elsewhere?) plus a premium for risk. Higher uncertainty justifies a higher discount rate.
What if costs and benefits occur over different time horizons? That's exactly what discounting solves. A project with high upfront costs and long-term benefits might look bad on Year 1 but show positive NPV over five years. Extend your analysis horizon to capture the full lifecycle—but be more skeptical of benefits that are far in the future, as they're harder to predict.
How does cost-benefit analysis relate to ROI? ROI (Return on Investment) = (Net Benefits ÷ Costs) × 100%. It's closely related to BCR. If BCR = 1.64, ROI = 64%. NPV tells you the absolute value created; BCR and ROI tell you the return per dollar invested. Use NPV to compare projects of different sizes; use BCR/ROI to compare efficiency.
- Intangibles: Estimate proxies (e.g., reduced churn, lower turnover costs)
- Discount rate: 8–12% for corporate decisions, adjusted for risk
- Different time horizons: Use NPV to compare across the full project lifecycle
- ROI vs. BCR: ROI = (BCR − 1) × 100%. NPV is absolute; BCR/ROI is relative
Applying Cost-Benefit Analysis to Your Decisions
Pick a decision you're currently facing that involves a significant resource commitment. Define the decision precisely and identify the baseline (what happens if you do nothing). List every cost you can think of—direct, indirect, and opportunity costs. List every benefit—direct, indirect, and intangible. Convert everything to present-value dollars. Calculate NPV and BCR. Run sensitivity analysis on your key assumptions.
If NPV is positive and BCR exceeds 1.0, you have a financially justified decision. If NPV is negative, you need a compelling strategic rationale to proceed—or you need to find ways to reduce costs or increase benefits. The discipline of going through this process, even when the math is rough, improves decision quality because it forces you to confront trade-offs explicitly.
Razn is an AI workspace that helps you structure problems into issue trees, answer-first documents, and decks. When you need to build a cost-benefit analysis—listing costs and benefits, calculating NPV, running scenarios—Razn helps you organize the thinking and present the recommendation clearly. Use it when the decision is complex enough to document.
- Define the decision, list costs, list benefits, monetize, calculate NPV and BCR
- NPV > 0 and BCR > 1.0 = financially justified; otherwise, find strategic rationale or improve the numbers
- Use Razn to structure the analysis and present the recommendation