FrameworksNovember 18, 20267 min read
Fishbone Diagram: How to Find the Root Cause of a Business Problem (Worked Example)
A fishbone diagram maps every possible cause of a problem onto one page, grouped by category, so you can test them instead of guessing. Here's how to make a fishbone diagram step by step, which categories to use for a business problem, when to use it instead of 5 Whys, and a worked example with numbers.
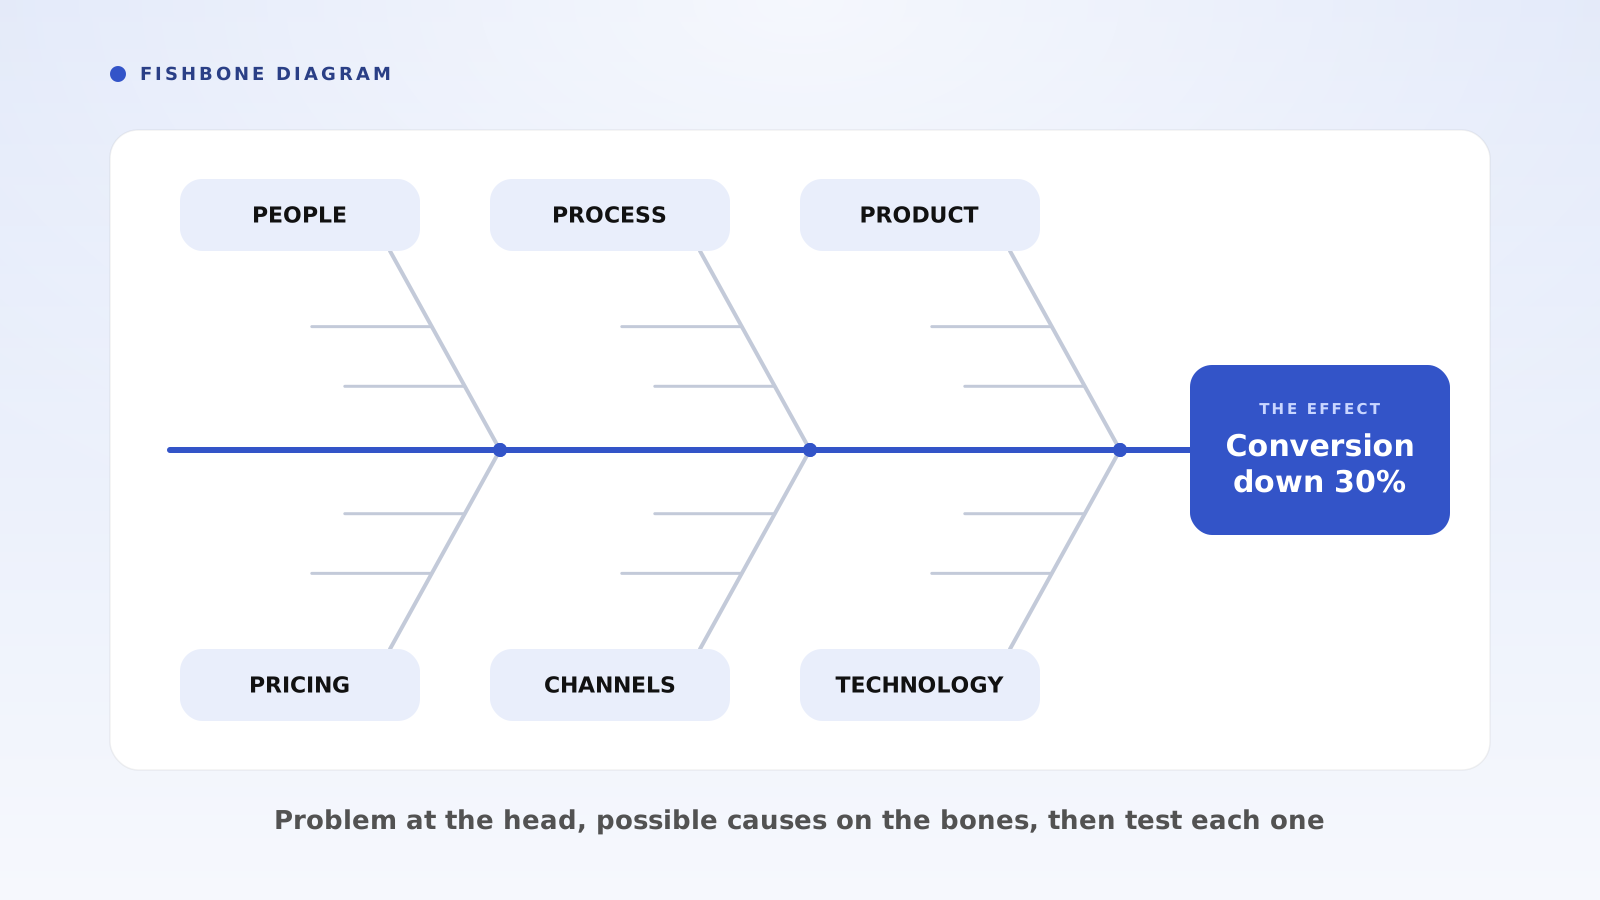
What Is a Fishbone Diagram?
A fishbone diagram is a visual tool for finding the root cause of a problem. You write the problem at the head of the fish, draw one bone for each category of possible cause, and list the specific causes along each bone. It lets a team see every plausible explanation on one page before deciding which ones to test.
It is also called an Ishikawa diagram, after Kaoru Ishikawa, the engineer who popularized it in Japanese manufacturing in the 1960s, and a cause-and-effect diagram, because the problem is the effect and the bones are its causes.
A fishbone diagram is most useful when a metric has moved and nobody agrees why. It stops the team from fixing the first cause someone suggests. It does not prove anything by itself: a finished diagram is a map of hypotheses, and the root cause is whichever ones the data confirms.
What Are the Categories on a Fishbone Diagram?
The classic version uses six categories known as the 6Ms. They were designed for factories, so most business teams adapt them. Pick four to six categories that cover your problem without overlapping.
- The 6Ms (manufacturing): Manpower (people), Methods (process), Machines (equipment), Materials (inputs), Measurement (data and inspection) and Mother Nature (environment).
- People: skills, staffing, training and incentives.
- Process: handoffs, approval steps, response times and policies.
- Product: features, quality, onboarding and reliability.
- Pricing: price level, plans, discounts and billing terms.
- Channels: where customers come from, such as ads, partners, search and referrals.
- Technology: systems, integrations, checkout and outages.
- Measurement: tracking changes and definitions that make a metric look worse than it is. Check this one early.
How Do You Make a Fishbone Diagram?
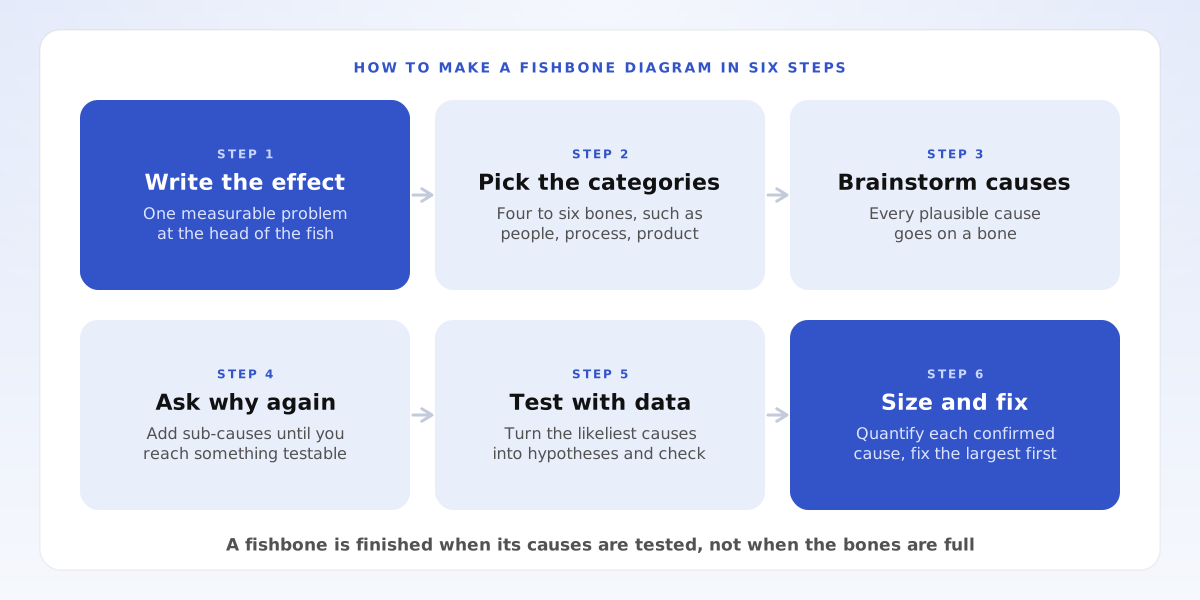
1. Write the effect at the head. State the problem as one measurable change with a size and a time frame, such as "trial-to-paid conversion fell from 18% to 12.6% in eight weeks." A vague head produces vague bones, so start from a clear problem statement.
2. Pick the categories. Draw a horizontal spine and add four to six angled bones, one for each category.
3. Brainstorm causes. Bring in the people closest to the work and ask what in each category could have produced the effect. Write every plausible cause on its bone. Do not debate yet.
4. Ask why again. For each cause, ask why it would happen and add the answer as a smaller bone. Stop when you reach something specific enough to check.
5. Test with data. Choose the likeliest causes and write each one as a hypothesis that data can confirm or reject, the core of hypothesis-driven problem solving. Cross out the causes the evidence rules out.
6. Size and fix. Quantify how much of the effect each confirmed cause explains, then fix the largest and cheapest first. An impact-effort matrix helps you order the fixes.
Fishbone Diagram Example: Why Did Trial-to-Paid Conversion Drop 30%?
A subscription software company gets 2,000 free trials a month. Its trial-to-paid conversion fell from 18% to 12.6% in eight weeks, a 30% drop. That is 252 new customers a month instead of 360. The missing 108 customers, at $90 a month each, cost $9,720 in new monthly recurring revenue every month the problem continues.
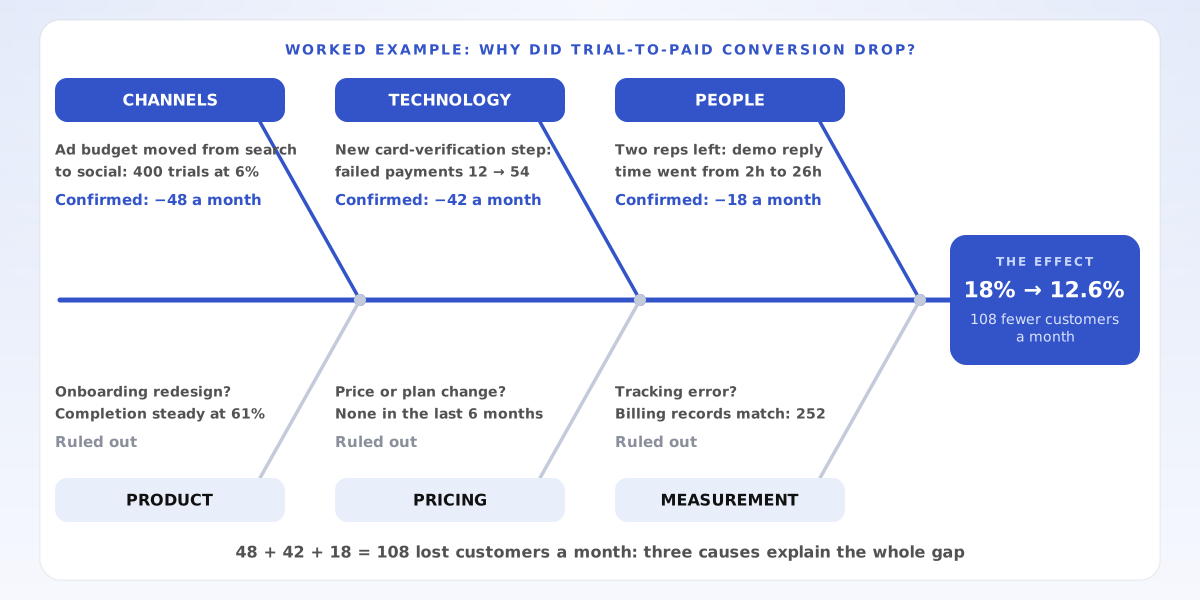
The team draws a fishbone diagram with six bones and lists one or two candidate causes on each. Then they test every cause against data instead of voting on the most likely one.
Three causes are ruled out. Billing records show exactly 252 new paying customers, so it is not a tracking error. There has been no price or plan change in six months. Onboarding was redesigned, but the share of trials completing it is steady at 61%.
Three causes are confirmed. First, the ad budget moved from search to social. About 400 trials a month now come from social ads and convert at 6% instead of 18%, which is 48 fewer customers. Second, a new card-verification step went live at checkout, and failed payments rose from 12 to 54 a month, which is 42 fewer customers. Third, two sales reps left, and the reply time to demo requests went from 2 hours to 26 hours. The 300 trials a month that request a demo now convert at 24% instead of 30%, which is 18 fewer customers.
The three causes add up: 48 plus 42 plus 18 is 108, the whole gap. The team fixes checkout and demo reply times first because both take days, not months. That recovers 60 customers a month and lifts conversion to 15.6%. Moving the ad budget back to search closes the rest.
- Effect: conversion down from 18% to 12.6%, 108 fewer customers a month
- Channels: 48 customers a month (44% of the gap)
- Checkout: 42 customers a month (39% of the gap)
- Slow demo replies: 18 customers a month (17% of the gap)
- Ruled out: tracking, pricing and onboarding
Fishbone Diagram vs 5 Whys: Which Should You Use?
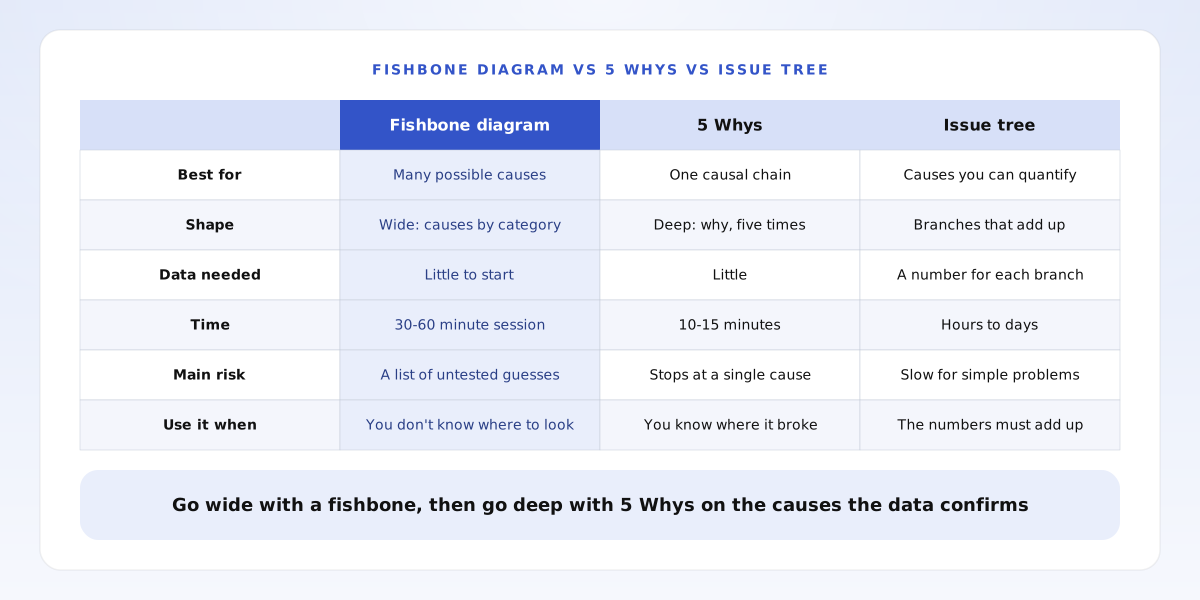
Use a fishbone diagram when the problem could have many causes and you do not yet know where to look. Use 5 Whys when you already know where the problem sits and need to trace one chain of cause and effect down to its origin. The fishbone goes wide; 5 Whys goes deep.
They work best together. In the example, the fishbone found the checkout problem, and asking why a few more times showed the verification step had been switched on for every card, including regions where it is not required. That is the root cause to fix.
When the causes can be measured and need to add up to the total, as they did here, an issue tree gives you a stricter structure than either. Our guide to root cause analysis with 5 Whys and issue trees covers both methods in detail.
What Are Common Fishbone Diagram Mistakes?
Treating the diagram as the answer. A full fishbone is a list of guesses. The work is in testing them.
Writing a vague effect. "Sales are down" invites every complaint in the company. A number and a time frame keep the causes relevant.
Listing symptoms as causes. "Customers are unhappy" is another effect. Keep asking why until you reach something you can change.
Stopping at one cause. Business problems usually have two or three causes at once. Size each one so you know how much of the gap is still unexplained.
Frequently Asked Questions
Is a fishbone diagram the same as an Ishikawa diagram? Yes. Fishbone diagram, Ishikawa diagram and cause-and-effect diagram are three names for the same tool.
What are the 6Ms of a fishbone diagram? Manpower, Methods, Machines, Materials, Measurement and Mother Nature. Outside manufacturing, teams usually swap them for categories such as people, process, product, pricing, channels and technology.
How many causes should a fishbone diagram have? Enough to cover every plausible explanation, usually two to five per bone. If one bone has ten causes, split the category.
Can you make a fishbone diagram alone? Yes, but it is better with the people closest to the work, because each of them sees a different part of the problem.
How Does Razn Help You Find the Root Cause?
Razn is an AI workspace that helps you structure problems, build issue trees and reach answer-first recommendations. Use it when a fishbone diagram has given you a long list of possible causes and you need to turn them into a structure you can test: Razn helps you sharpen the problem statement, organize the causes into an issue tree, track which hypotheses the evidence supports and write up the recommendation with the reasoning attached. It is free during beta.
- Put one measurable effect at the head
- Use four to six categories that fit your business
- Test every likely cause with data
- Size the confirmed causes and fix the largest first


