FrameworksOctober 27, 20266 min read
Impact Effort Matrix: How to Prioritize What to Work On (With a Worked Example)
An impact effort matrix helps you decide what to work on by plotting initiatives on two axes. Here's how to build one, score your options, and focus on what actually moves the needle.
What Is an Impact Effort Matrix?
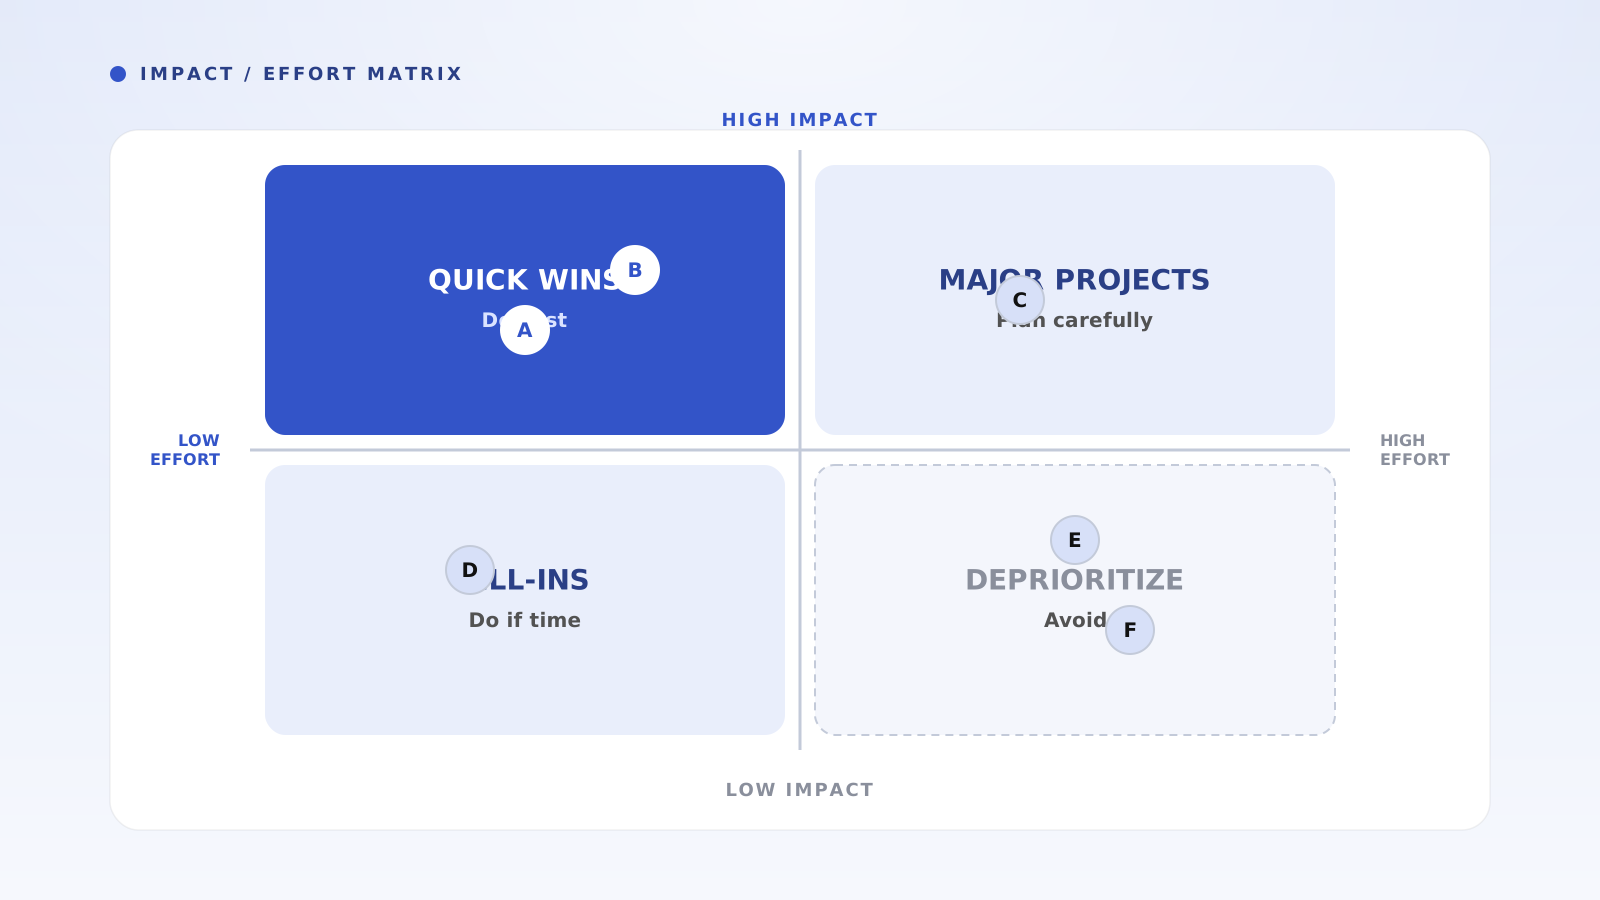
An impact effort matrix is a prioritization tool that plots initiatives on two axes: impact (the value delivered if you succeed) and effort (the resources required to execute). By placing each option in one of four quadrants, you quickly see which work to tackle first, which to plan carefully, and which to skip entirely.
The framework is sometimes called a 2x2 prioritization matrix, an effort-impact grid, or a value-effort matrix. The names differ; the logic is the same. You're separating high-value, low-cost wins from resource-draining distractions—and making that distinction visible to everyone on the team.
- Impact: the business value delivered if this initiative succeeds
- Effort: the time, money, and people required to ship
- The matrix surfaces quick wins and exposes resource traps
What Are the Four Quadrants?
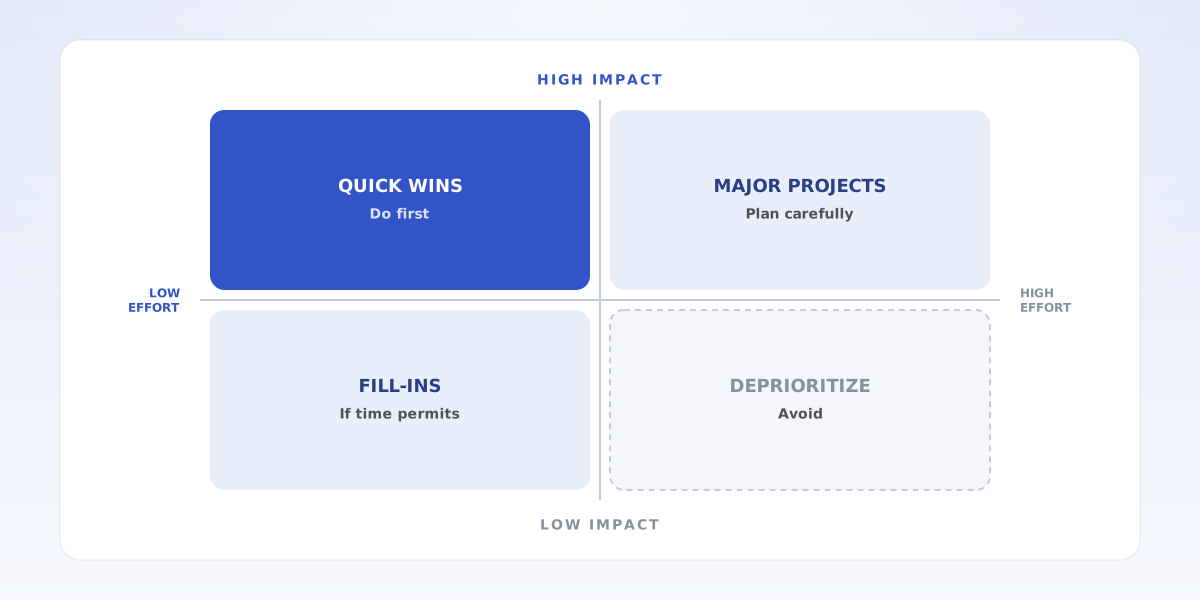
The matrix divides into four zones based on where an initiative lands. Quick Wins (high impact, low effort) are your top priority—they deliver outsized value for minimal cost, so do them first. Major Projects (high impact, high effort) are worth pursuing but require planning, staffing, and risk management; schedule them after quick wins.
Fill-ins (low impact, low effort) are small tasks you can slot into gaps between bigger work—useful for momentum but not strategic. Deprioritize (low impact, high effort) is the danger zone: these initiatives consume resources without moving the needle. Saying no here is as important as saying yes elsewhere.
- Quick Wins (top-left): High impact, low effort—do first
- Major Projects (top-right): High impact, high effort—plan carefully
- Fill-ins (bottom-left): Low impact, low effort—do if time permits
- Deprioritize (bottom-right): Low impact, high effort—avoid or cut
How Do You Score Impact and Effort?
Use a simple 1–5 scale for both axes. For impact, ask: if this succeeds, how much does it move our key metric? A 5 means a major revenue, retention, or strategic outcome; a 1 means a marginal improvement no one will notice. For effort, ask: how many team-days (or story points, or dollars) does this require? A 5 means months of work across multiple people; a 1 means a single person can ship it in a day.
Score all initiatives before plotting. If you score and plot one at a time, you'll anchor on early placements and skew the rest. Involve cross-functional stakeholders—engineering, design, and product often estimate effort differently, and averaging their views reduces blind spots. Write down your scoring criteria so the team can challenge or calibrate them.
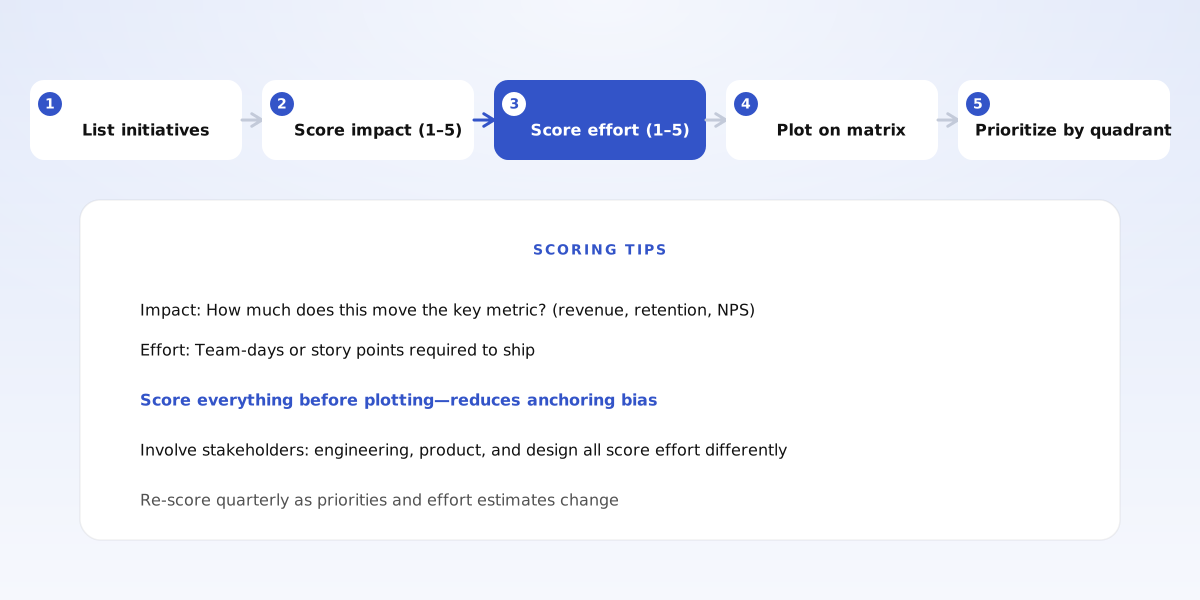
- Impact (1–5): How much does success move the key metric?
- Effort (1–5): How many team-days or story points to ship?
- Score all items first, then plot—avoids anchoring
- Involve engineering, design, and product for effort estimates
A Worked Example: Prioritizing a Product Backlog
A product team has eight initiatives competing for the next quarter. They score each on impact and effort, then assign quadrants and priority. Onboarding redesign scores 5 on impact (directly improves activation) and 2 on effort (one designer, two weeks)—it's a Quick Win, priority one. Checkout bug fix scores 4 impact, 1 effort—another Quick Win, priority two.
Mobile app rewrite scores 5 impact but 5 effort (three engineers, four months)—a Major Project, priority three. Admin dashboard lands in the same quadrant at 4/4. Help center update is low impact (2) and low effort (1)—a Fill-in to slot between bigger work. Legacy API cleanup, dark mode, and dashboard widgets all land in Deprioritize: their effort outweighs their value, so they're cut or deferred.
The matrix made the trade-offs explicit. Without it, the team might have gravitated toward the mobile rewrite because it sounded exciting—even though two quick wins would ship faster and deliver comparable total value.
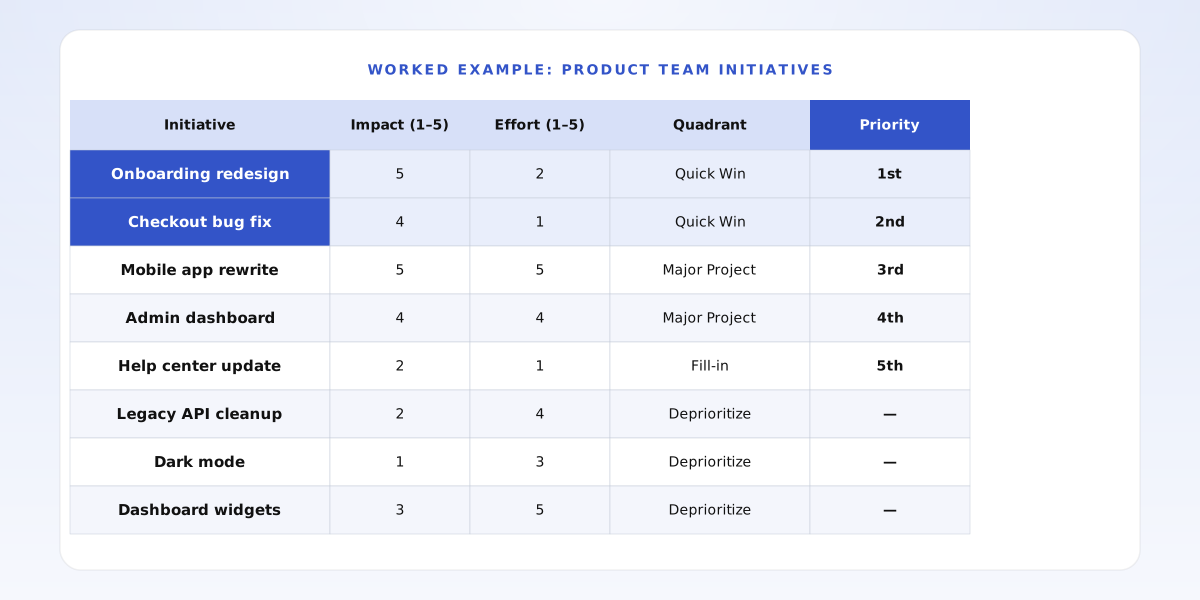
- Quick Wins (Onboarding redesign, Checkout fix): priorities 1–2
- Major Projects (Mobile rewrite, Admin dashboard): priorities 3–4
- Fill-in (Help center): do if time
- Deprioritize (Legacy API, Dark mode, Widgets): cut or defer
Common Mistakes to Avoid
The first mistake is inflating impact scores because an initiative is someone's pet project. If every item scores 4 or 5, the matrix loses its power to differentiate. Force-rank your initiatives before scoring, then check that scores match the ranking—if they don't, recalibrate.
The second mistake is underestimating effort. Teams routinely forget integration work, testing, documentation, and rollout. If your quick wins keep taking twice as long as expected, your effort estimates are too optimistic. Pad for unknowns or score conservatively.
The third mistake is treating the matrix as permanent. Priorities shift, estimates improve, and new information arrives. Revisit the matrix quarterly—or whenever a major assumption changes. A stale matrix is worse than no matrix because it creates false confidence. See 80/20 prioritization for how to keep re-ranking as evidence lands.
- Avoid score inflation: if everything is high-impact, nothing is
- Avoid effort underestimates: include integration, testing, and rollout
- Avoid staleness: re-score quarterly or when assumptions change
How Does This Relate to Other Prioritization Frameworks?
The impact effort matrix is one tool in a broader prioritization toolkit. A decision matrix adds more criteria and weights, useful when impact isn't the only thing that matters (e.g., strategic fit, risk, dependencies). An issue tree breaks a problem into testable branches before you prioritize solutions. Opportunity cost analysis quantifies what you give up by not choosing the next-best option.
Use the impact effort matrix when you have many options and need a fast filter. Use a weighted decision matrix when the trade-offs are more complex. Combine with 80/20 thinking to focus on the vital few after the matrix has surfaced them.
- Impact effort matrix: fast filter for many options on two axes
- Decision matrix: more criteria, weighted trade-offs
- Issue tree: decompose problems before prioritizing solutions
- Opportunity cost: quantify what you give up by not choosing the best
Frequently Asked Questions
How many initiatives can I score at once? Aim for 5–15. Fewer than five and the matrix is overkill; more than fifteen and the quadrants get crowded. If you have dozens of ideas, group similar ones or do a rough cut first.
Who should be in the room? Cross-functional representation improves accuracy: product owns impact estimates, engineering owns effort, design weighs in on both. A solo exercise often underestimates effort and overestimates pet-project impact.
What if an item lands on the border? Treat it as the more conservative quadrant. An initiative on the line between Quick Win and Major Project is effectively a Major Project until you can reduce its effort.
Can I use this for personal decisions? Yes—any choice with trade-offs between value and cost fits the framework. Career moves, side projects, even weekend plans can be plotted. The discipline is the same: score, plot, prioritize.
- 5–15 initiatives is the sweet spot
- Include product, engineering, and design for balanced estimates
- Borderline items go to the more conservative quadrant
- Works for personal decisions, not just product backlogs
Putting It Into Practice
Gather your list of initiatives—whatever is competing for the team's time. Score impact and effort on a 1–5 scale, using the criteria above. Plot each item on the matrix. Work through the quadrants in order: quick wins first, then major projects, fill-ins as bandwidth allows, deprioritize the rest. Document the matrix so stakeholders can see the rationale.
Razn is an AI workspace for structured thinking. You can list your initiatives, score them, and visualize where they land—then turn that prioritization into a workplan or a decision memo. When you need to explain why some projects made the cut and others didn't, the matrix is already documented and shareable.
- List, score, plot, prioritize—in that order
- Work quadrants sequentially: Quick Wins → Major Projects → Fill-ins → Deprioritize
- Document the matrix so stakeholders see the reasoning


