FrameworksNovember 5, 20266 min read
RICE Scoring Model: How to Prioritize Projects With a Simple Formula (Worked Example)
The RICE scoring model ranks projects by Reach × Impact × Confidence ÷ Effort, so you can compare very different ideas with one number. Here's how to score each factor, with a worked example.
What Is the RICE Scoring Model?
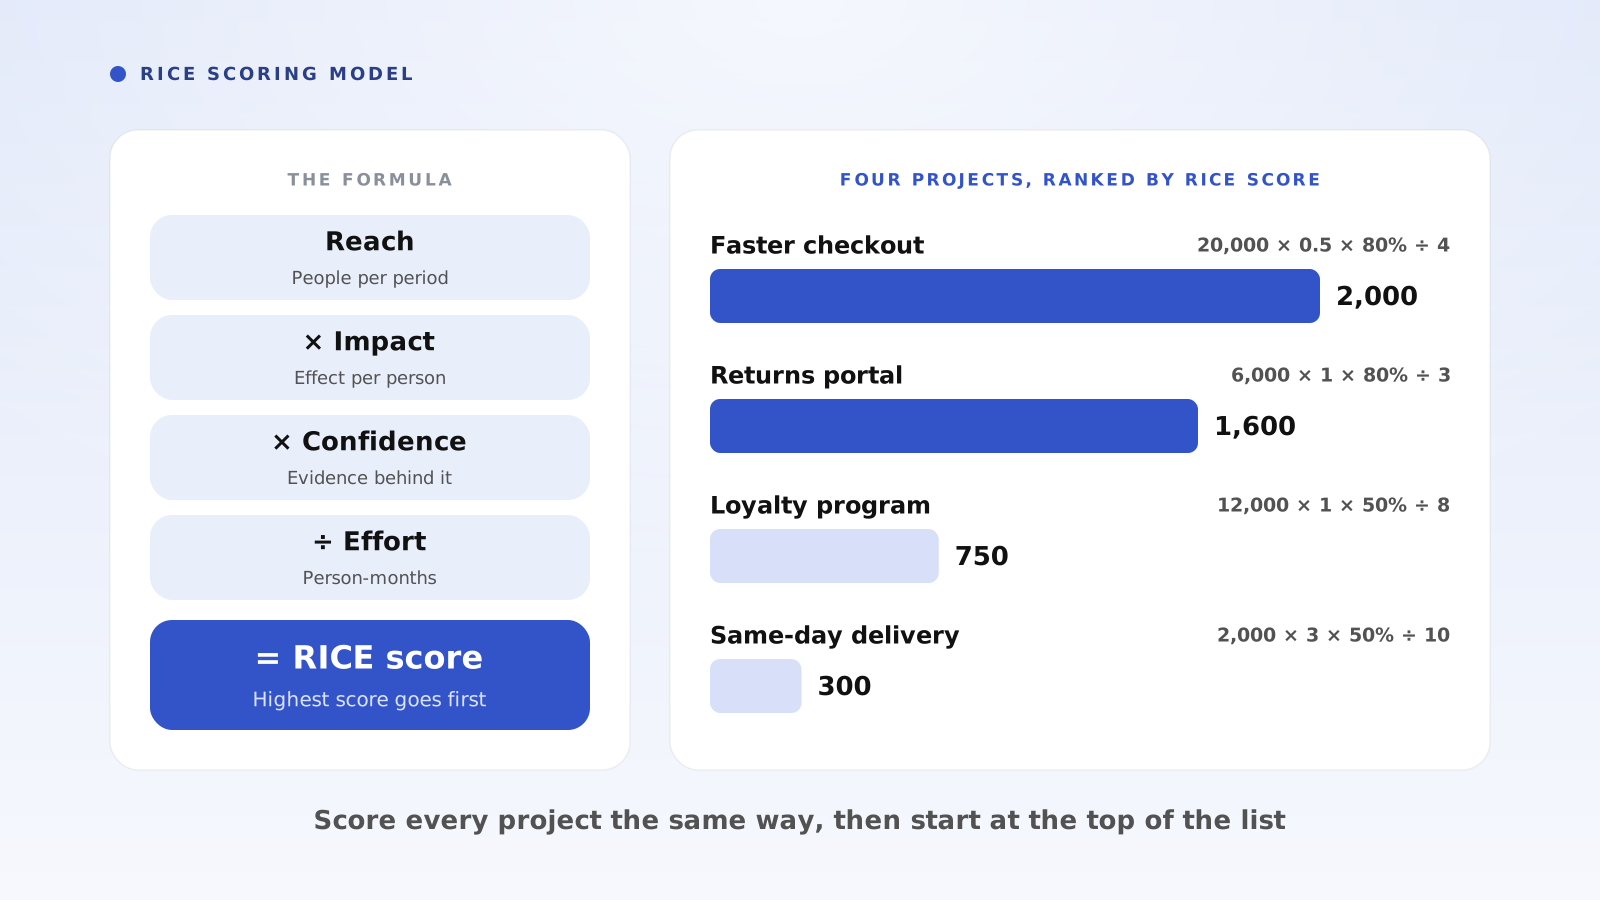
The RICE scoring model is a prioritization method that ranks projects by one number: Reach × Impact × Confidence ÷ Effort. A higher score means more expected benefit for each unit of work, so you start at the top of the list. It is most useful when several reasonable ideas compete for the same limited team.
The method was popularized by the product team at Intercom, which wanted a consistent way to compare ideas that affect different numbers of people. Product teams still use it most, but the logic works for any list of projects: marketing campaigns, operations improvements, internal tools or customer service changes.
What Do Reach, Impact, Confidence and Effort Mean?
Each letter answers one question about a project. Reach asks how many people it will affect in a set period. Impact asks how much it will change things for each of those people. Confidence asks how much evidence stands behind your estimates. Effort asks how much work it will take from everyone involved.
Reach and effort are real estimates in real units. Impact and confidence use fixed scales, which stops anyone from claiming a 10x outcome on instinct. Confidence is the term that makes RICE different from a plain benefit-to-cost ratio, because it lowers the score of an exciting idea with thin evidence.
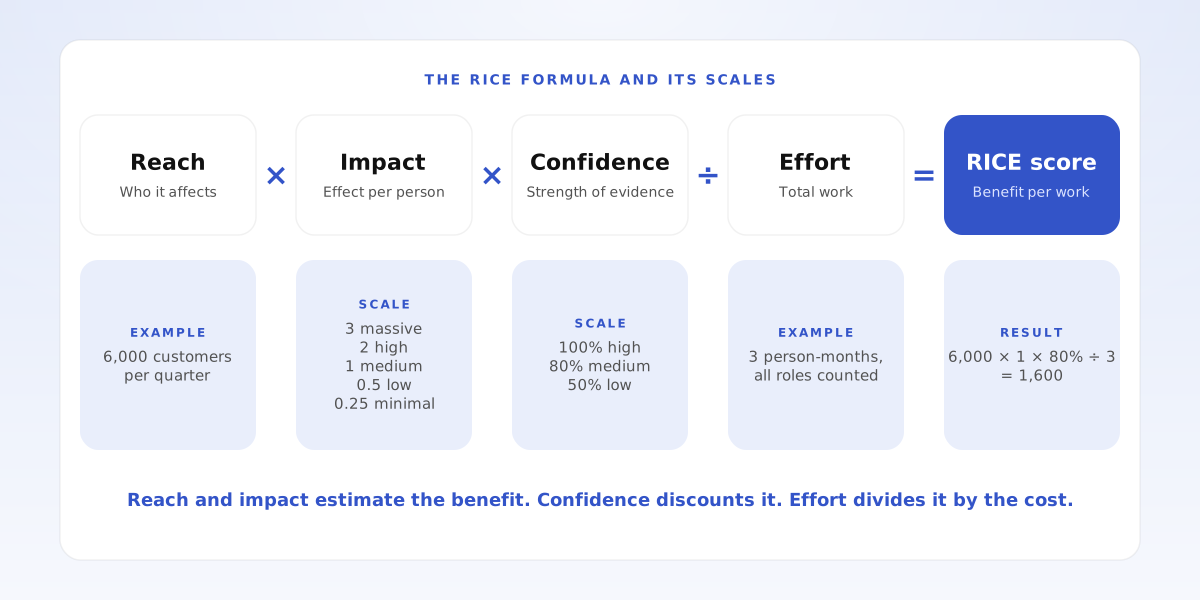
- Reach: people or events affected per period, such as customers per quarter
- Impact: effect per person, where 3 = massive, 2 = high, 1 = medium, 0.5 = low and 0.25 = minimal
- Confidence: strength of the evidence, where 100% = high, 80% = medium and 50% = low
- Effort: total work across all roles, usually in person-months
How Do You Calculate a RICE Score?
1. Name the goal and list the candidates. Impact only means something relative to a goal, such as more repeat purchases or fewer support tickets. If the list is long, cut the obvious low-value items first with an 80/20 pass.
2. Estimate reach over one shared period. Use the same unit and time window for every project, and pull numbers from your own data where you can.
3. Score impact on the fixed scale. Write down what a 1 and a 3 look like for this goal, so people score against the same standard.
4. Assign confidence based on evidence. Use 100% when you have solid data for reach and impact, 80% when you have partial evidence, and 50% when the estimate is mostly a hunch.
5. Estimate effort in person-months. Count everyone who has to do the work, including design, operations, legal and support.
6. Calculate, sort and review. Multiply reach, impact and confidence, divide by effort, and sort from high to low. Then check the top of the list against capacity and dependencies before you commit.
Worked Example: Which Projects Should an Online Retailer Fund?
An online retailer has eight person-months available next quarter and four proposals. The goal is more repeat purchases, and reach is measured in customers per quarter.
Faster checkout reaches 20,000 customers with low impact (0.5), 80% confidence and 4 person-months of effort: 20,000 × 0.5 × 0.8 ÷ 4 = 2,000. A returns portal reaches 6,000 customers with medium impact (1), 80% confidence and 3 person-months: 6,000 × 1 × 0.8 ÷ 3 = 1,600. A loyalty program reaches 12,000 customers with medium impact, 50% confidence and 8 person-months: 12,000 × 1 × 0.5 ÷ 8 = 750. Same-day delivery reaches 2,000 customers with massive impact (3), 50% confidence and 10 person-months: 2,000 × 3 × 0.5 ÷ 10 = 300.
Same-day delivery has the biggest impact per customer and still finishes last, because few customers would get it, the evidence is thin and it needs the most work. It also exceeds the quarter's capacity on its own.
The decision is to fund checkout and returns, which use 7 of the 8 person-months. Before dividing by effort, those two projects deliver 8,000 + 4,800 = 12,800 confidence-adjusted customer impact. The loyalty program would use all eight person-months to deliver 6,000.
The spare person-month can go to a small loyalty test. If the test lifted confidence to 80%, the score would rise to 12,000 × 1 × 0.8 ÷ 8 = 1,200, which is still third but much closer for next quarter's review. That kind of what-if is a simple sensitivity analysis on your scores.
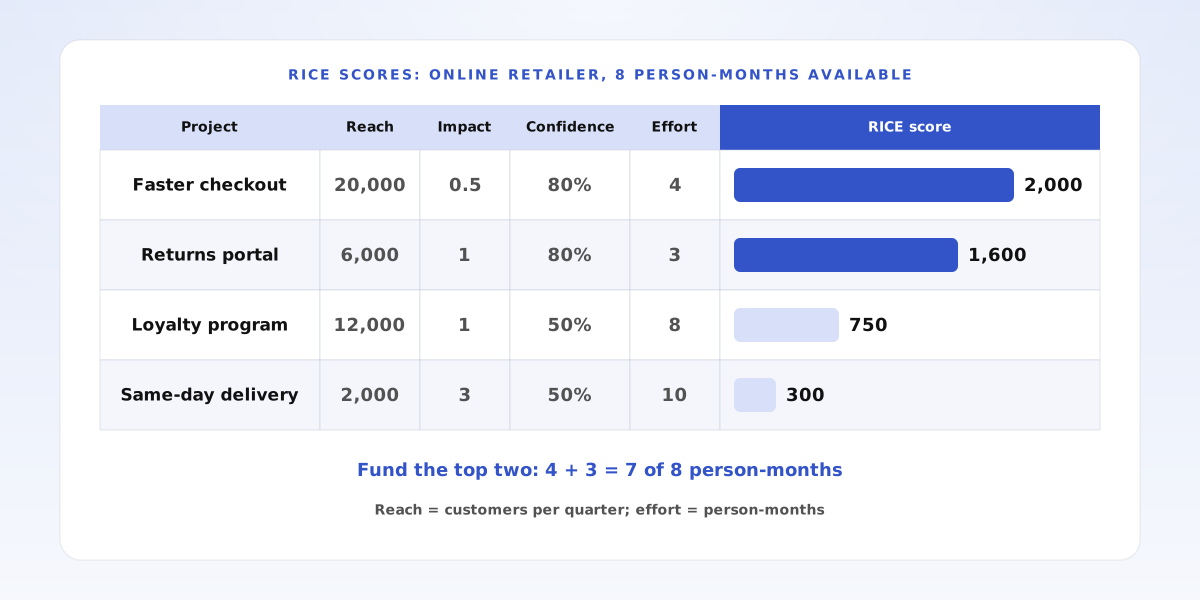
- Ranking: checkout 2,000, returns 1,600, loyalty 750, same-day delivery 300
- Capacity: checkout and returns use 7 of 8 person-months
- Next step: test the loyalty program, then re-score it next quarter
Related: a website conversion drop, why inventory is too high
RICE vs. Impact Effort Matrix: What's the Difference?
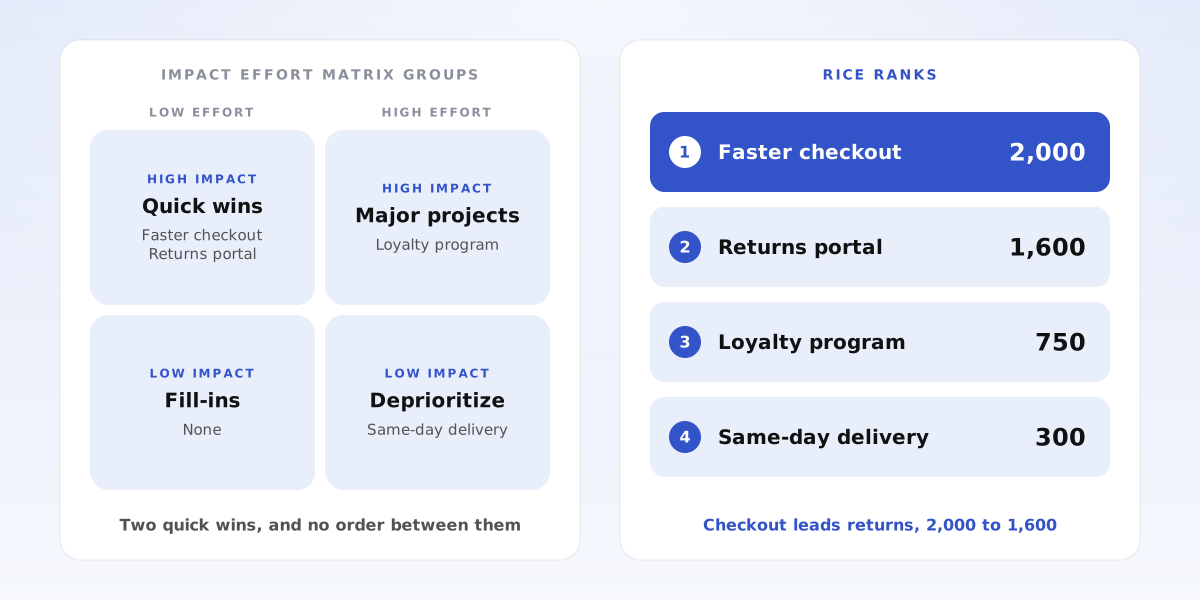
An impact effort matrix sorts work into four quadrants using two judgments. RICE turns four estimates into a ranked list. Put the retailer's projects on a matrix, and checkout and returns both land in Quick Wins with nothing to separate them. RICE puts checkout ahead, 2,000 to 1,600.
Use the matrix for a fast first sort in a workshop. Use RICE when audience size varies from project to project, or when capacity forces you to choose between good options. For one choice across several criteria, such as picking a vendor, use a decision matrix. When a single project involves enough money to justify a full financial case, run a cost-benefit analysis.
What Are Common RICE Scoring Mistakes?
Inflating impact. If every project gets a 2 or a 3, the factor stops separating anything. Agree on written examples for each level, then challenge scores as a group.
Treating confidence as optimism. Confidence should reflect evidence, so ask what data supports the number. An idea with no data stays at 50%, however much the team likes it.
Counting only one team's effort. A project that takes one engineer a month can also take weeks of support, training and legal review. Leave those out and large cross-functional projects look cheaper than they are.
Mixing units. Comparing customers per quarter with visits per month produces a meaningless ranking, so keep one unit and one time window per list.
Letting the score make the decision. Legal requirements, dependencies and strategic bets can justify a lower-scoring project. Override the ranking when you need to, and write down why.
Frequently Asked Questions
What is a good RICE score? There is no universal benchmark. Scores depend on your units and audience size, so they only mean something relative to other projects scored on the same list.
Can teams outside product use RICE? Yes. Reach can be employees, invoices, stores or support tickets. Choose the unit that fits the goal and use it for every project on the list.
What is the difference between RICE and ICE? ICE scores Impact, Confidence and Ease, usually from 1 to 10 each. It is faster, but it has no reach factor, so it is weaker when projects affect very different numbers of people.
How often should you re-score? Re-score at each planning cycle, and whenever new evidence changes a project's reach, impact, confidence or effort.
Can I calculate RICE in a spreadsheet? Yes. Give each factor its own column, add one formula column for the score, and sort by it.
How Does Razn Help With RICE Scoring?
A RICE score can only rank the options you thought to list. Razn builds issue trees that structure a problem into its drivers and possible moves. Use it when your goal is clear and your project list is not: break the goal down in Razn, turn the strongest branches into candidates, then score them with RICE. Razn is free during beta.
- Name one goal and list the candidate projects
- Score reach, impact, confidence and effort the same way for each
- Sort by score, then check capacity and dependencies
- Test the assumptions behind low-confidence projects and re-score


