MethodNovember 4, 20266 min read
Sensitivity Analysis: How to Find the Assumptions That Drive Your Decision (Worked Example)
Sensitivity analysis shows how much a result changes when one input changes, so you know which assumptions actually matter before you commit. Here's how to run one step by step, with a tornado chart and a worked example.
What Is Sensitivity Analysis?
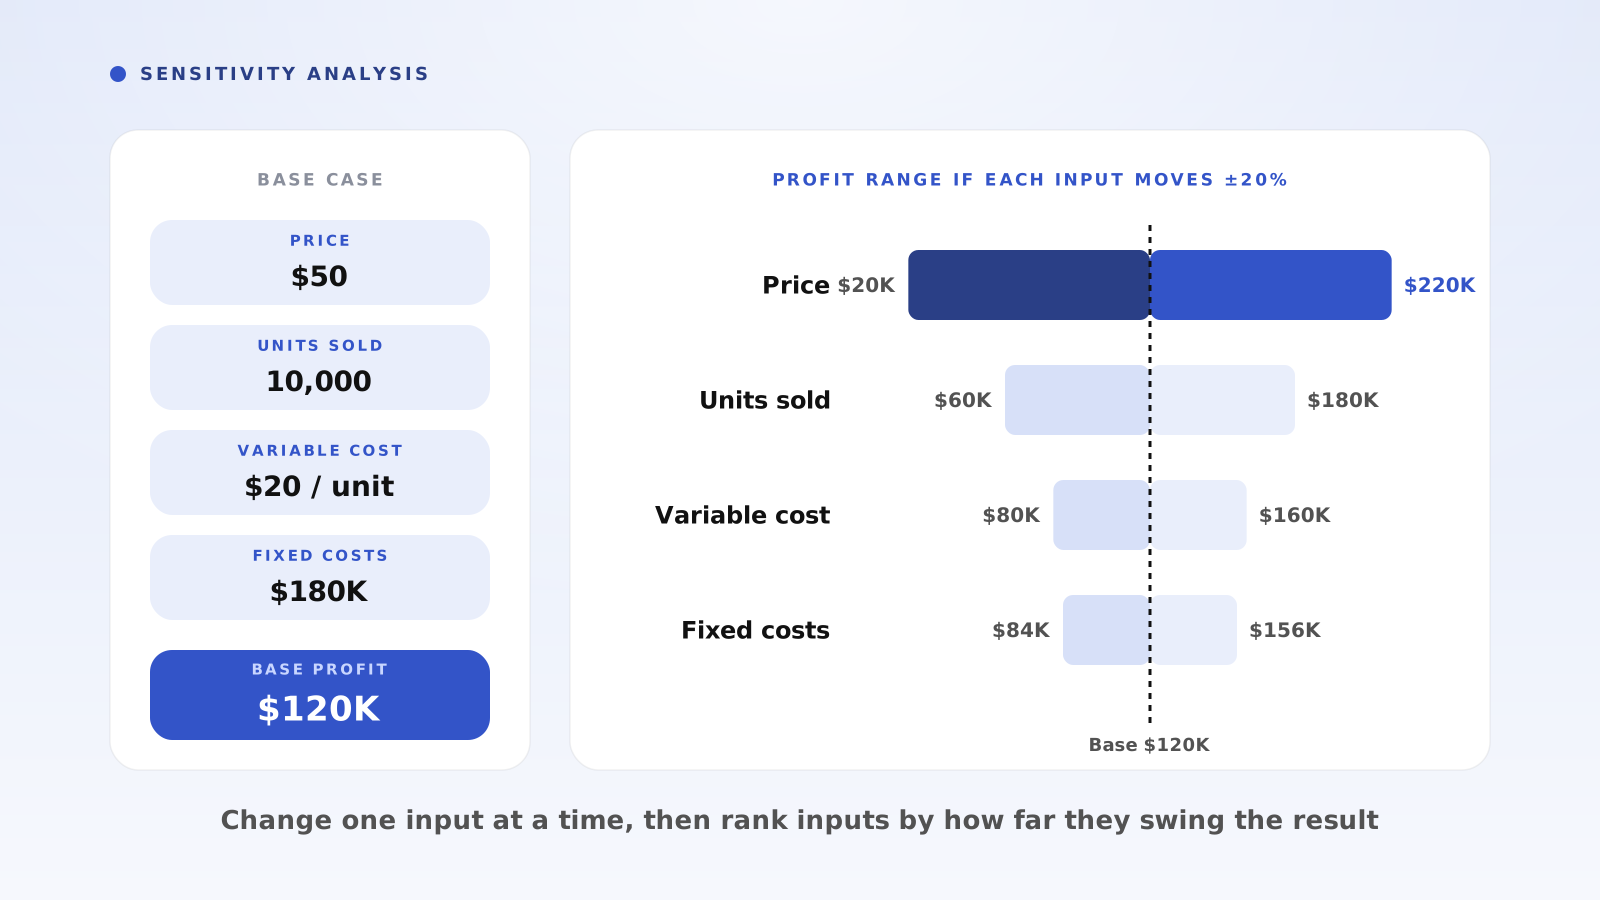
Sensitivity analysis is a method for testing how much the result of a decision changes when you change one input assumption at a time. It tells you which assumptions your decision really depends on, so you can spend your time checking those and stop worrying about the rest.
Every business decision rests on a model, even if the model lives in your head: a price, a volume, a cost, a timeline. Each of those numbers is a guess. Sensitivity analysis asks a simple question of each guess: if this is wrong by a realistic amount, does the answer change?
Two terms are worth knowing. The base case is your best estimate for every input. The switching value (or break-point) is the value of an input at which the decision flips, for example the price at which a launch stops making money. The gap between the base case and the switching value is your margin of safety.
- Sensitivity analysis: change one input, hold the rest at base, and measure the change in the output
- Base case: your best estimate for every input
- Switching value: the input value at which the decision flips
- The goal is to find the few assumptions that matter, not to predict the future
Why Does Sensitivity Analysis Matter for Business Decisions?
Most models have five to fifteen inputs, but usually only two or three of them drive the result. Without a sensitivity analysis, teams tend to debate the inputs that are easiest to argue about rather than the ones that move the outcome. A finance lead spends a week tightening the rent estimate while nobody tests the price assumption that could erase the profit.
Sensitivity analysis also changes what you do next. If the decision holds across every realistic range, decide and move on. If one input can flip it, that input becomes your research priority: run a pilot, get a quote, or test the price before committing. It pairs naturally with break-even analysis, which tells you the threshold, and cost-benefit analysis, which gives you the base case to flex.
How Do You Do a Sensitivity Analysis?
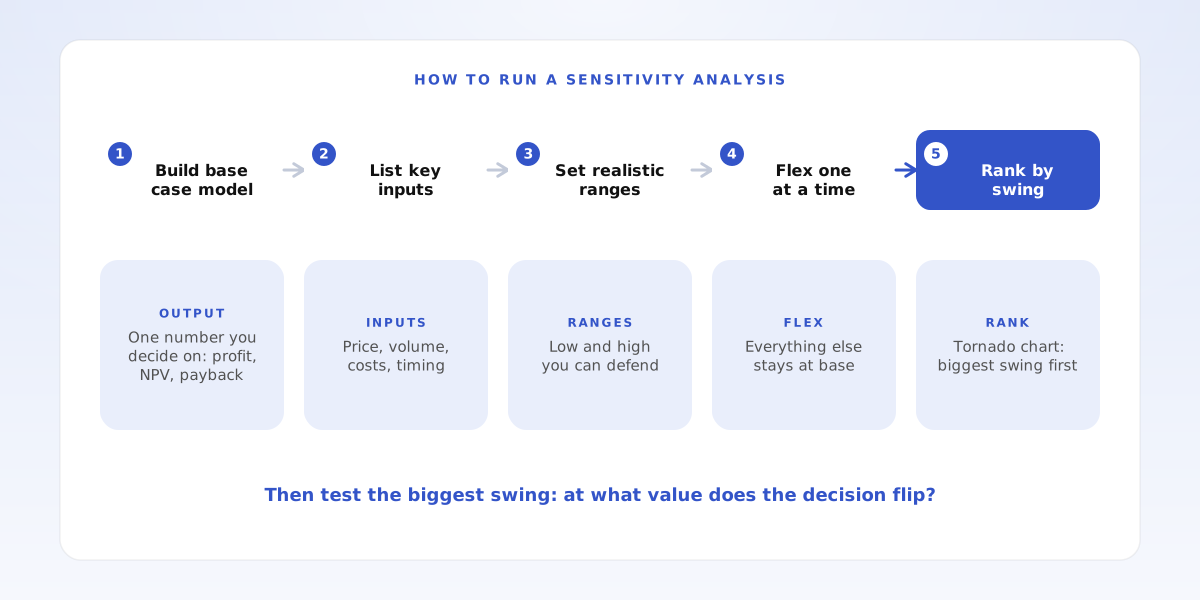
1. Build the base case. Pick one output you will decide on, such as annual profit, net present value or payback period, and write down your best estimate for every input that feeds it.
2. List the key inputs. Typical candidates are price, volume, unit costs, fixed costs, growth rate and timing. If you are unsure what drives the output, break it down first with an issue tree or from first principles.
3. Set a realistic low and high for each input. A flat ±20% is a fine starting point, but ranges you can defend are better: supplier quotes, historical variance, or competitor prices.
4. Flex one input at a time. Move a single input to its low, then its high, while every other input stays at base. Record the output each time.
5. Rank inputs by swing and find the switching values. Sort inputs by the difference between their high and low results. Plot them as a tornado chart, with the widest bar on top. For the top one or two inputs, solve for the value at which the decision flips.
Worked Example: Which Assumption Drives a Product Launch?
A company is deciding whether to launch a new product. The base case: 10,000 units a year at a price of $50, a variable cost of $20 per unit, and $180,000 in fixed costs. Contribution margin is $50 − $20 = $30 per unit, so annual profit is 10,000 × $30 − $180,000 = $120,000.
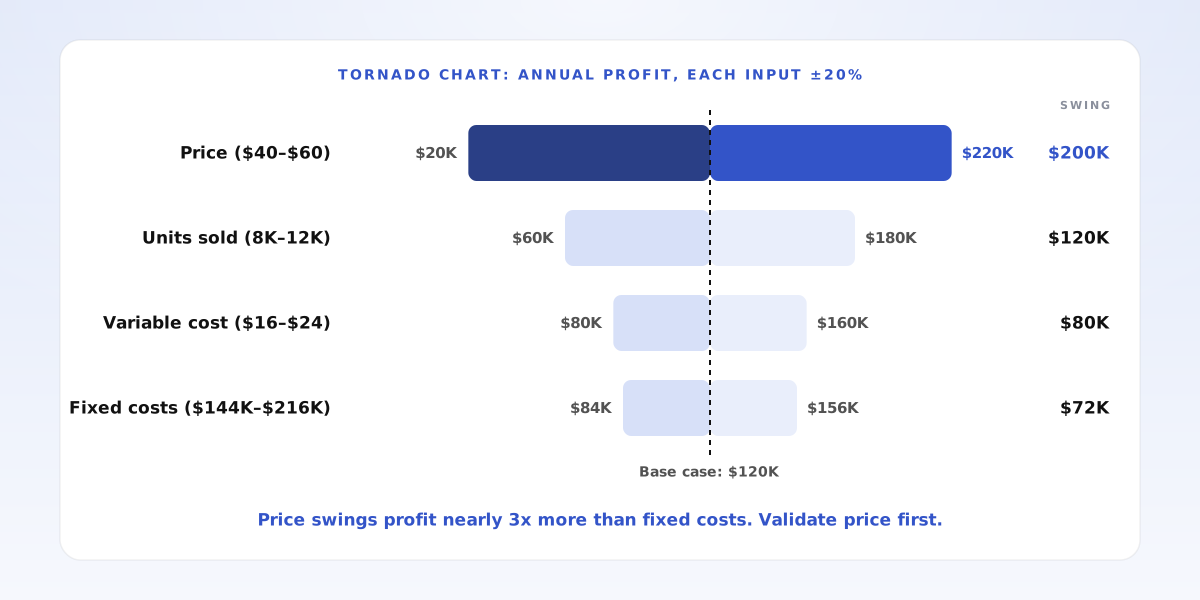
Now flex each input by ±20%, one at a time. Price at $40 gives 10,000 × $20 − $180,000 = $20,000; at $60 it gives $220,000. That is a $200,000 swing. Units at 8,000 give $60,000 and at 12,000 give $180,000, a $120,000 swing. Variable cost at $16 gives $160,000 and at $24 gives $80,000, an $80,000 swing. Fixed costs at $144,000 give $156,000 and at $216,000 give $84,000, a $72,000 swing.
The tornado chart makes the ranking obvious: price moves profit nearly three times as much as fixed costs. Each 1% change in price ($0.50) moves profit by $5,000, about 4.2% of the base case.
How Do You Find the Switching Value?
For the inputs at the top of the tornado, solve for the point where the decision flips. Here, profit hits zero when 10,000 × (price − $20) = $180,000, so price = $38. The launch survives a 24% price cut. Volume is safer: profit hits zero at $180,000 ÷ $30 = 6,000 units, a 40% shortfall.
A one-way sensitivity table shows the same story in steps. Every $1 of price moves profit by $10,000, so a modest discount to win a big customer has a large, visible cost. The decision: launch, but validate willingness to pay at $50 with a small pilot before locking in the price, because price is the load-bearing assumption.
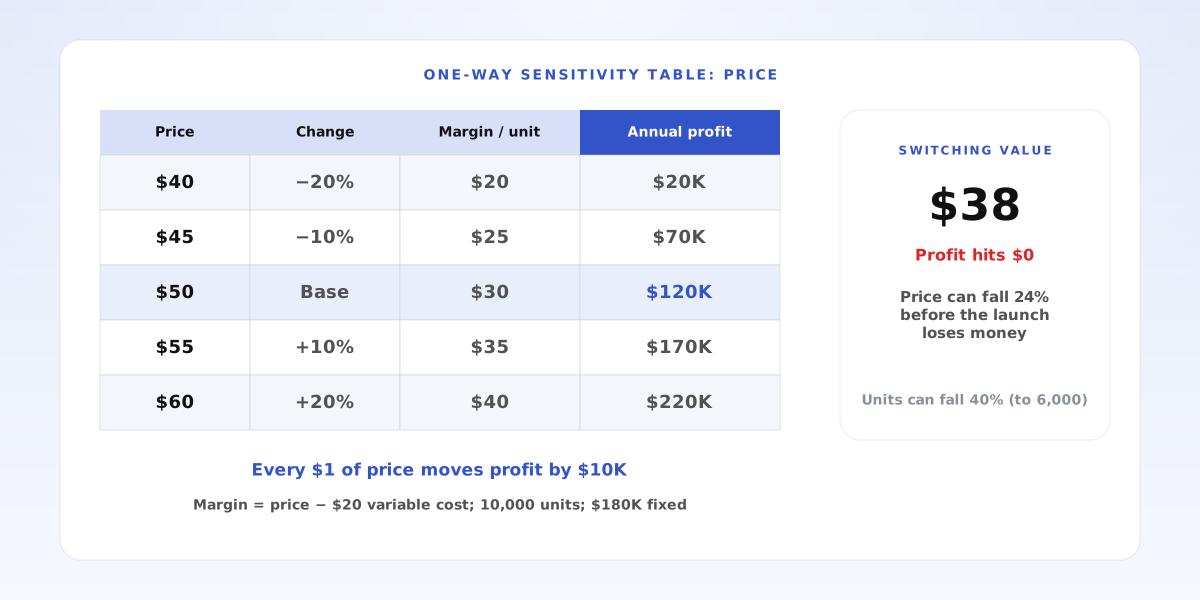
- Base case profit: $120,000
- Biggest swing: price ($200,000), then units ($120,000), variable cost ($80,000), fixed costs ($72,000)
- Switching values: price $38 (−24%), units 6,000 (−40%)
- Action: test price with a pilot before committing
Sensitivity Analysis vs. Scenario Analysis: What's the Difference?
Sensitivity analysis changes one variable at a time to show which inputs matter. Scenario planning changes several variables together to build coherent futures, such as a recession where volume and price both fall. Use sensitivity analysis first to find the drivers, then build scenarios around those drivers. If you can attach probabilities to the outcomes, a decision tree turns them into an expected value.
What Are Common Sensitivity Analysis Mistakes?
Using the same range for everything. A ±20% swing in rent is unlikely; a ±20% swing in first-year volume is optimistic. Uniform ranges are a starting point, not a conclusion.
Ignoring linked inputs. Price and volume usually move together: raise price and you sell fewer units. One-way analysis treats them as independent, so check combined moves with a scenario.
Stopping at the chart. A tornado chart is only useful if it changes what you do next. Name the top assumption, its switching value, and the cheapest way to test it.
Frequently Asked Questions
What is a tornado chart? A horizontal bar chart that shows the output range for each input, sorted with the widest bar on top. The shape looks like a tornado, and the top bars are the assumptions that matter most.
Can I do sensitivity analysis in Excel or Google Sheets? Yes. Build the base case in one column, then use a data table (What-If Analysis in Excel) or simply copy the model and change one cell per column.
What percentage should I flex inputs by? Start with ±10% or ±20% to compare inputs on equal terms, then replace those with realistic ranges for the top drivers.
Is sensitivity analysis only for financial models? No. Any decision with a numeric output works: hiring plans, capacity, project timelines, or the scores in a decision matrix.
How Does Razn Help With Sensitivity Analysis?
Sensitivity analysis only works if you have listed the right inputs, and that is a structuring problem. Razn builds issue trees that break a decision into its drivers, helps you form hypotheses about which ones matter, and turns the result into an answer-first recommendation. Use it before you open a spreadsheet: map what drives the outcome in Razn, then flex those inputs in your model. Razn is free during beta.
- Build a base case and pick one output to decide on
- Flex each key input one at a time across a realistic range
- Rank inputs in a tornado chart and find switching values for the top ones
- Test the load-bearing assumption before you commit


